Practice Trades Cal 1.12 (Part 2)
Posted by Mark on March 4, 2022 at 07:12 | Last modified: December 24, 2021 12:34I left off questioning whether I should exit Cal 1.12 at max loss despite being well-positioned inside the profit tent.
From a systematic, programming standpoint, I don’t see how to do breakeven (BE) estimation with time spreads without Black-Scholes and/or volatility skew modeling. This precludes implementation of a Python backtester.
From an “art of trading” standpoint, my gut says “no way no how” do I take max loss when I am well inside the profit tent (strongly supportive of a high TD) like this.* To convince me otherwise, I will be on the lookout for cases where I remain in such trades only to meet a horrific demise.
Exit two trading days later at 73 DTE for profit of $552 (15.3%). SPX is up 0.13 SD to 3011 with IV up 5.9% over the 5 days, TD = 96, and horizontal skew remaining at +1.8%.
Part of me wonders if it might require extraordinary discipline to exit still being positioned near the center with TD so high.
If I stayed in, then when would I look to exit?
Moving ahead to 11 DTE:
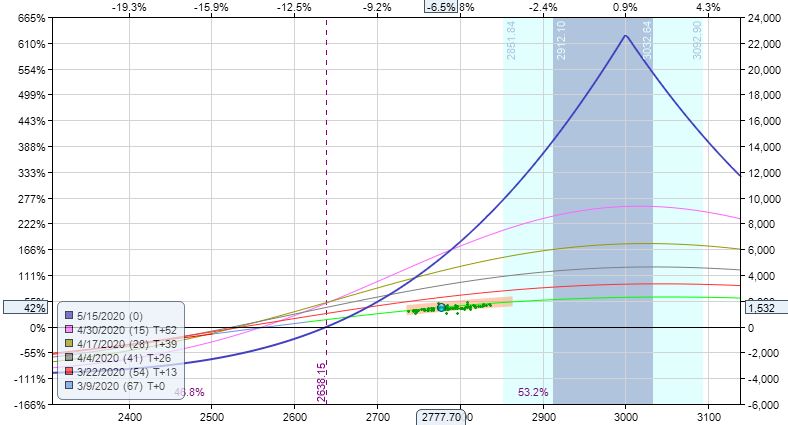
I am now approaching the downside BE. While still 140 points away, I am certainly getting to the “slim pickins'” portion of the graph compared to what lies to the right. TD is 10 at this point and trade is +42.5%, which would be an absurd amount to lose should the market continue lower.
This would be a decent time to exit. I may not be able to code this discretionary interpretation, but said “art of trading” still seems alluring as a viable tool.
Finally, I’m a bit curious about the margin requirement (MR). I mentioned in this third paragraph that high IV may cause time spreads to be expensive. Such is not the case with Cal 1.12. I will grant that Cal 1.12 IV (~35%) is nowhere near that seen in Cal 1.3, but it still seems relatively high whereas MR seems relatively low. With starting DTE, horizontal skew, and [average] IV [proprietarily calculated over the whole option matrix in ONE] all potential contributing factors, how can this be explained?
I will pick up here next time.
* — This is 31.3% of the way between BEs.