The Pseudoscience of Trading System Development (Part 2)
Posted by Mark on June 14, 2016 at 06:15 | Last modified: May 4, 2016 10:01Last time I outlined a trading system covered by Perry Kaufman and offered some cursory critique. Today I want to cut deeper and attack the heart of his April Modern Trader article.
With this trading system, Kaufman presents a complex, multivariate set of conditions. He includes an A-period simple moving average, a B-period stochastic indicator, a C (D) stochastic entry (exit) threshold, an E (F) threshold for annualized volatility entry (exit), and a G-period annualized volatility. Kaufman has simplified the presentation by assigning values to each of these parameters and providing results for a single parameter set:
A = 100
B = 14
C = 15
D = 60
E varies by market
F = 5%
G = 20
I believe development of a trading system is an optimization exercise. Optimizing enables me to decrease the likelihood that any acceptable results are fluke by identifying plateau regions greater than a threshold level for my dependent variable (or “subjective function“). Optimization involves searching the parameter space, which by definition cannot mean selecting just one value and testing it. This is what Kaufman has done and herein lies my principal critique.
Kaufman should have defined ranges of parameter values and tested combinations. Maybe he defines A from 50-150 by increments of five (i.e. 50, 55…145, 150), B from 8-20 by increments of two (i.e. 8, 10… 18, 20), etc. The number of total tests to run is the product of the number of possible values for each parameter. If A and B were the only parameters of the trading system then he would have 21 * 7 = 147 runs in this example. The results could be plotted.
Here is what I don’t want to see:
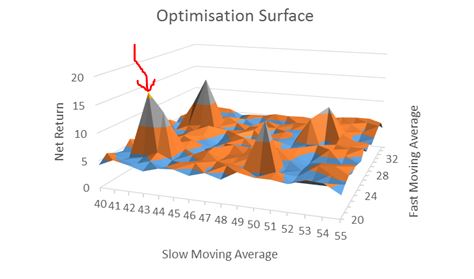
[I found this on the internet so please assume the floor to be some inadequate performance number (e.g. negative)]
A robust trading system would not perform well at particular parameter values but perform poorly with those values slightly changed. This describes a spike area as shown by the red arrow: a chance, or fluke occurrence.
Kaufman claims to have “broad profits” with his system but I cannot possibly know whether his parameter set corresponds to a spike or plateau region because he did not test any others. No matter how impressive it seems, I would never gamble on a spike region with real money. Graphically, I want to see a flat, extensive region that exceeds my performance requirements. To give myself the largest margin of safety I would then select parameter values in the middle of that plateau even if the values I choose do not correspond to the absolute best performance.
Categories: System Development | Comments (1) | Permalink