Naked Puts (Part 8)
Posted by Mark on December 10, 2015 at 05:38 | Last modified: November 5, 2015 07:15I want to go in another direction today and consider exactly how I might go about doing the naked put trade, which really becomes a question about position size.
As I prepared the initial graph comparing naked puts with long shares, I became aware how much capital risk this arbitrary position size was commanding:
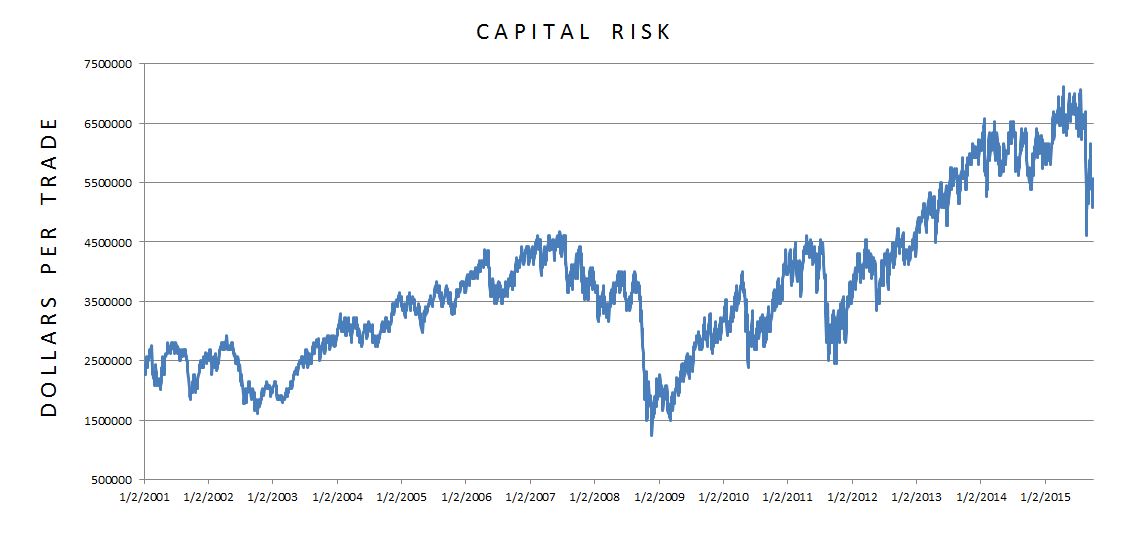
The graph illustrates two important points:
(1) This is not a constant capital-risk trade
(2) Capital risk is extremely large.
With regard to backtesting, (1) is very important. Position sizing should be held constant throughout the system development process. This allows for an apples-to-apples comparison of PnL changes throughout the period of study. A drawdown (DD) at any point should be evaluated as if it occurred from Day 1; this is one way of interpreting maximum risk.
Even though capital risk did not remain constant, contract size did and for that reason I believe the backtest is acceptable. I had a gross dollar target range for profit and maximum loss that remained constant regardless of underlying price. Leverage, being directly proportional to capital risk, is what changes. This is a difficult concept to understand.
With regard to (2), it especially became evident how large capital risk is when I realized the graph shows one trade at a time. With an average of 27.6 days in trade, I can multiply the average capital risk by 27.6 to get an estimate of how much capital risk is on at any given time. Over the 14+ years that number is $103M each day!
To personalize this trade, clearly I have to cut down the position size and then make some decisions about whether the return potential vs. expected DD is acceptable for me.
Categories: Backtesting | Comments (3) | PermalinkNaked Puts (Part 7)
Posted by Mark on December 7, 2015 at 05:16 | Last modified: November 5, 2015 06:51Comparing long shares and naked puts with equal capital risk ended up being far superior for the latter in terms of drawdown (DD).
If I cut the long shares position size by a factor of eight, here is how the two compare:
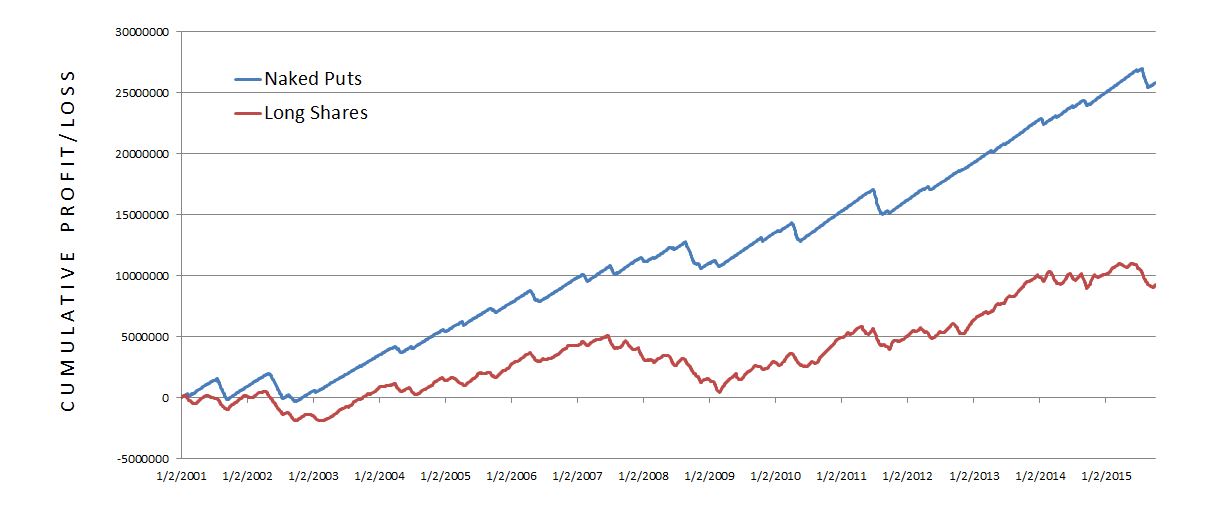
This is a huge difference. The long shares now gain $9.31M (down from $74.5M) compared to the (same) $25.8M for the naked put trade. In other words, observation 1 has been reversed. The naked put trade still has a lower max DD (-$2.27M vs. -$4.65M). The naked put trade still has better consistency with an average (mean) daily DD of -$378K (vs. -$924K). The naked put trade is still in DD only ~49% of the time (vs. ~82%).
The naked put trade appears to make more money with greater consistency than long shares.
For me, putting context around this trade means playing devil’s advocate over and over again. This trade certainly looks pretty good. What am I missing?
Particularly impressive to me is the fact that even with 8x as much capital risk, the option trade has less DD risk.
But it does now have eight times as much capital risk. Were the market to take a huge hit, the option trade could lose much more than the long shares.
In deciding whether to do this trade, I think one’s level of pessimism must be assessed. The “huge hit” that would cause the naked put trade to lose more than long shares would have to be worse than what we’ve seen since 2001. So if you are truly the prophet of doom, you worry about a catastrophe worse than the Flash Crash (2010), than the August 2015 correction, than September 11 (2001)… you worry about a decline worse than the 2008 financial crisis.
Depending on your exact level of paranoia, at some point I would wonder why you are even in the market at all. Keeping your money safe under the mattress might be a better choice.
Alternatively, maybe you simply follow the same traditional recommendation given for long shares: allocate a limited percentage of the portfolio to naked puts.
Categories: Backtesting | Comments (0) | PermalinkNaked Puts (Part 6)
Posted by Mark on December 3, 2015 at 06:24 | Last modified: November 5, 2015 06:55The third observation I made in comparing performance identified much greater consistency with the naked puts than the long shares trade.
The greater consistency can be seen in terms of the straight blue line that moves in a narrow range relative to the jagged red line that moves in a wide range.
An even better illustration of this is seen in the drawdown (DD) graph. The blue line spends most of its time near the top ($0) whereas the red line does not. More specifically, the long shares are in DD for 3033 trading days (~82% of the time) vs. 1827 trading days (~49% of the time) for the naked put trade.
Psychologically, “days in DD” is a very important measure of trade consistency and how likely I am to stick with the strategy. When in DD I feel something between “slightly annoyed” or “not overly happy” to despondent, angry, sleep-deprived, and freaking out. The excruciating psychic pain that forces me to cash out at catastrophic loss happens while in DD. When not in DD, my account equity is reaching new highs. These are times I feel happy and on top of the world.
To better understand the naked put trade, I started out with an apples-to-apples comparison based on capital risk. Clearly while capital risk is the same, risk in terms of DD over the years is not. Once I determine my risk tolerance, capital allocation to the long shares would have to be much smaller than for the naked put trade to equalize the DD.
Put another way, for comparable levels of DD I am able to do the option trade in greater size than the long shares. This is not a surprise when we think about options in terms of leverage. What I find ironic is that people often say options are excessively risky because of their leverage. Here it becomes clear that only by increasing the option leverage can we get comparable risk, which completely flies in the face of “common wisdom.”
Categories: Backtesting | Comments (3) | Permalink