Naked Puts (Part 5)
Posted by Mark on November 30, 2015 at 06:21 | Last modified: November 5, 2015 06:57I left off with a graphical performance comparison between the long shares and naked put trades.
Aside from being a yardstick for starting equity required to do a trade, drawdown (DD) may also be understood in terms of risk tolerance. If I run a backtest and find a max DD of -$200,000 then I need to ask myself whether I would feel comfortable continuing to trade a strategy that had lost $200,000. Human nature is actually to overestimate risk tolerance since it’s easy to imagine how I might handle a particular loss but much more difficult to tough it out when I’m in the middle of it. Combine this with that trader’s adage “your worst DD is always ahead of you” and the number used to evaluate risk tolerance should be higher than the max DD.
To summarize, I have now discussed two ways of evaluating max DD: as a measure for starting equity and as a measure for risk tolerance. The biggest concern with insufficient starting equity is that I may go bust. In my opinion, though, the biggest risk for a trading strategy is not necessarily that it will bankrupt me. Rather, it is that I will lose enough money to get scared, to lose sleep, to be constantly worried, and other related feelings that will eventually force me to cash out at the absolute worst time possible to alleviate the psychic pain.
Here is a graph of DD for the naked put and long shares trade:
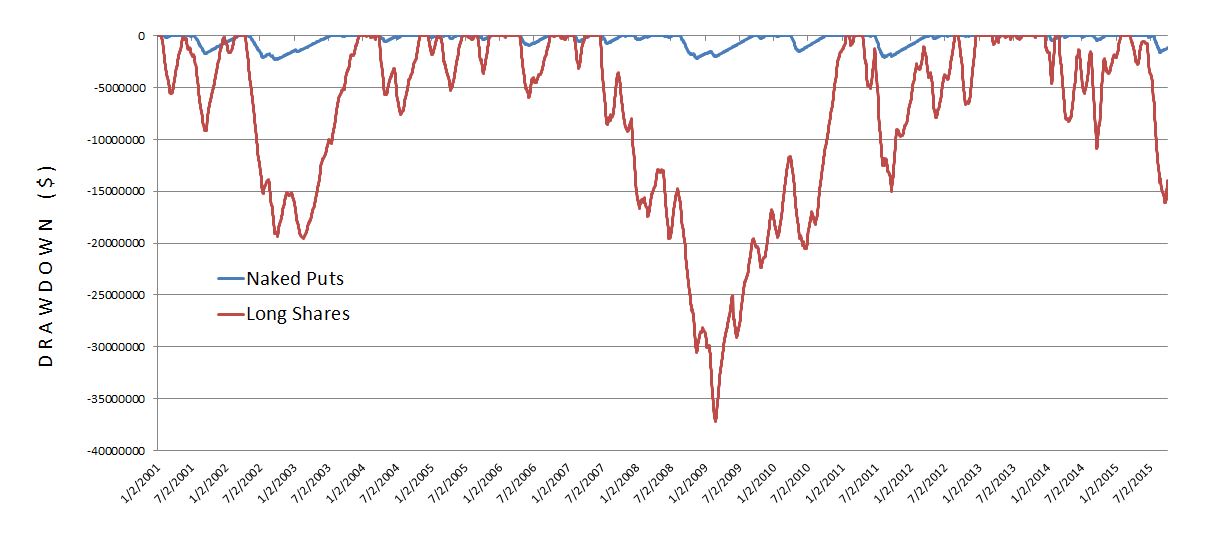
Clearly the long shares trade is far more risky than the naked put trade. The max DD is $37.2M for the long shares and $2.27M for the naked puts. On any given day, the long shares can be expected (arithmetic mean) to be in a $7.4M DD compared to $378K for the naked puts: a 19-fold difference! As a result, I would want to trade the long shares in much smaller size than I would the naked put trade and that would decrease the estimated profit I could expect from it.
Categories: Backtesting | Comments (1) | PermalinkNaked Puts (Part 4)
Posted by Mark on November 25, 2015 at 06:27 | Last modified: November 5, 2015 06:58In order to better understand the naked put trade, I have designed an apples-to-apples comparison between the naked put and long shares trade.
Here are the results:
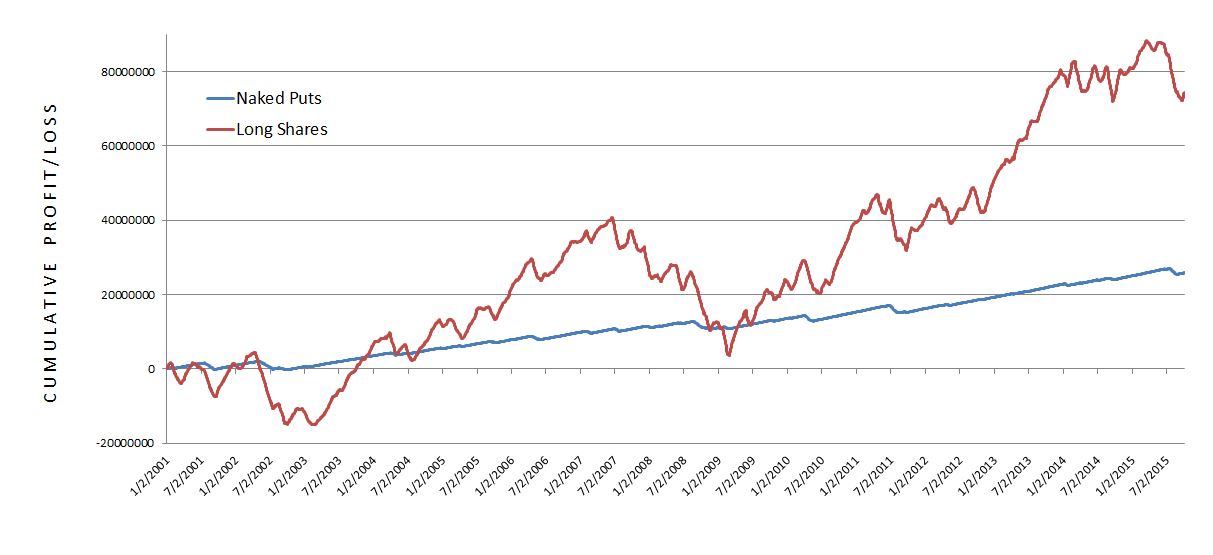
Three main observations jump out at me and I will discuss these in order:
- The shares trade is more profitable
- Drawdown in shares trade is much worse
- Naked puts are much more consistent
First, the shares trade is more profitable. No doubt about that! The shares gained $74.5M compared to $25.8M for the naked puts over 14+ years. Before I get starry eyed in thinking how I will do the shares trade and make sooooo much money, though, I need to better understand how much I can lose and how much I need to start the trade.
The latter detail is also addressed by 2 above: the drawdown (DD) in the long shares is much worse than the naked put trade. DD is the peak-to-trough decline during a specific period of an investment or trade. DD represents a minimum starting equity amount to do a trade. If the worst (maximum) DD ever seen over the period of a backtest is -$200,000 then I better have at least $200,000 in the account to do a trade. If I don’t then I’m at increased risk of going bust. Traders often say “your worst DD is always ahead of you” to suggest no matter what size DD you found in backtesting, a larger DD can be expected to occur in the future. To be safe, then, my starting equity should be greater than max DD.
DD is also important with regard to risk tolerance. I will pick up here next time.
Categories: Backtesting | Comments (3) | PermalinkNaked Puts (Part 3)
Posted by Mark on November 24, 2015 at 07:00 | Last modified: November 3, 2015 07:03I found some encouraging initial results with regard to the naked put trade but I still need more context to understand what that means and what I can reasonably expect from the strategy.
Prospective investors often want to know if a particular strategy beats its “benchmark.” In order to assess this, I will do an apples-to-apples comparison between naked puts and long shares by equalizing capital risk.
Capital risk for a naked put trade is roughly the strike price minus credit received multiplied by the number of contracts multiplied by 100. For each trade I get a trade gain/loss along with start/ending dates.
For the corresponding shares trade I took the naked put risk divided by underlying price at trade inception to get the number of shares purchased. I then multiplied this by the change in underlying price between the start/ending dates above to get the corresponding trade gain/loss.
As an example, suppose I sell 20 naked puts on XYZ stock, which is currently trading at $100/share. The strike price is $90 and I collect $2.00 per contract. If I get assigned then I have to pay $90/share but I collected $2/share up front. My total risk is therefore:
($90/share – $2/share) * 20 contracts * 100 shares/contract = $176,000.
If you’re into unit analysis, this is:
$/share * contracts * shares/contract = $
“Share” and “contract” mathematically cancel out.
For $176,000, I could buy $176,000 / $100/share = 1,760 shares. The corresponding profit/loss on the shares would then be the price change of XYZ during the trade multiplied by 1,760 shares.
The maximum potential profit on the naked puts would be $2.00/share * 20 contracts * 100 shares/contract = $4,000.
I will show results next time.
Categories: Backtesting | Comments (1) | PermalinkNaked Puts (Part 2)
Posted by Mark on November 23, 2015 at 07:27 | Last modified: October 31, 2015 14:28In my effort to put more context behind the trade, I found something dramatically different with naked puts than I did with naked calls.
As previously discussed, I’m trying to understand whether the trade offers an edge. Putting context behind a trade is an attempt to better understand what I can reasonably expect in terms of critical trade parameters like profit/loss, drawdown, and total risk.
Below is a graph of cumulative profit/loss across all trades from 1/2/01 through 9/18/15:
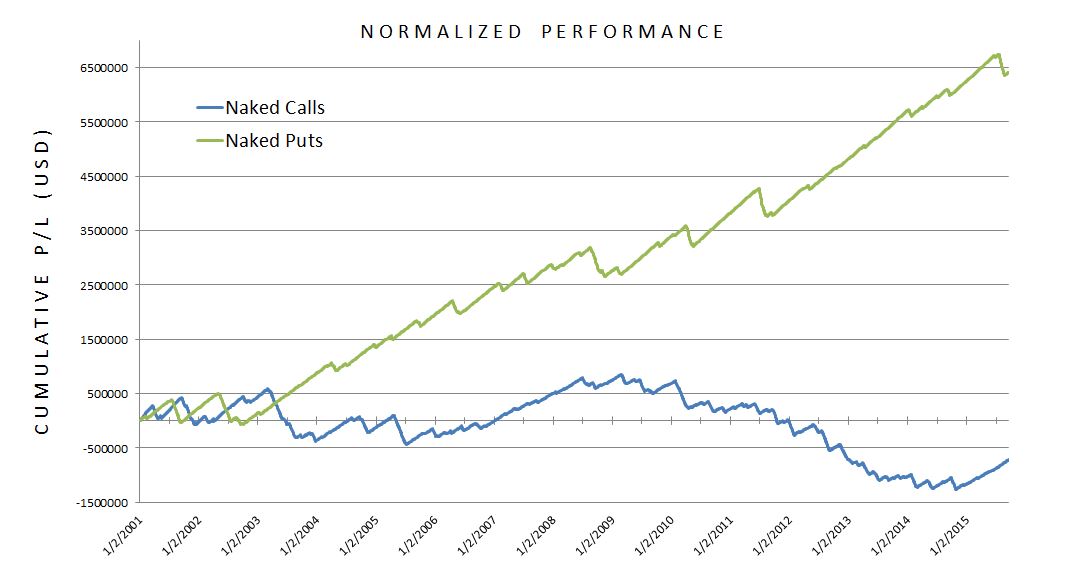
Normalized performance means I adjusted numbers for position size difference.
As an initial impression, I would not want to do the naked calls. Period. In following along that blue line, I see no reason to hold out any hope for consistent, long-term profitability.
The naked puts are a totally different story. The green line is, for the most part, beautiful and pretty much what I would expect for a bullish trade. If I highlight the market corrections:

Now we can clearly see [circled] September 11 (2001), the market downturn of 2002, the 2008 financial crisis, the Flash Crash (5/10/10), summer 2011, October 2014 (small), and the recent correction this past August.
The naked call trade is flat to lower with the market mostly up over the last 14+ years. I did expect to at least see profitability there, though, because of the margin of safety the trade affords.
The naked put equity curve, on another hand, seems amazingly resilient. I’m not happy with the first two years but that is to be expected from a bullish trade in a bear market.
So what does all this mean? Is there edge? Do I know yet? What context is still missing?
One thing that would help is comparison to a benchmark. I will move in that direction next time.
Categories: Backtesting | Comments (1) | PermalinkWasting Time
Posted by Mark on November 21, 2015 at 07:38 | Last modified: November 20, 2015 13:33Not too long ago, I wrote about a disappointing trader Meetup where little discussed was truly actionable with regard to profitable trading. This past week I heard something very similar.
The trader in question was asked for her opinion on where the market is headed. She replied:
“I feel that we’re caught in a range. There’s no impetus to [1]
do anything. People are scratching their heads over what the
Fed may or may do. We had a muted reaction to the terrorist [3]
attack in France, which didn’t surprise me since we were so
oversold at the time. We have the seasonality thing kicking [5]
in here. I was looking back last year wondering when the
Santa Claus rally was going to come. I know the week of [7]
Thanksgiving tends to be very bullish and then we did get a
pretty good selloff the first week of December followed by [9]
the Santa Claus rally. So this just tells me we’re going to
chop around here for the rest of the year.” [11]
Aside from seeming like a run-of-the-mill, absolutely mundane/typical opinion about the market, one thing that did jump out at me was just how tremendously useless it is. Did you notice all the clichés?
- “…which didn’t surprise me since we were so oversold at the time.”
- “We have the seasonality thing kicking in…”
- “…when the Santa Claus rally was going to come.”
- “…the week of Thanksgiving tends to be very bullish…”
Urban legend anyone? If you think not then show me the data.
Why even talk about this sort of thing? Nobody will hold us accountable if we’re wrong. It’s also not the sort of content that could help anyone make money even if we’re right because prognostications are not intended to be financial advice (unless it’s premium content, which savvy traders know exists just to make the services/newsletters money, anyway).
Maybe it’s intended as small talk meant for entertainment but I think discussions like this occur because people don’t realize what we really should be talking about and what we should be working on. We could try a scientific approach to some of the above-listed clichés but doing so is probably something most people never even consider.
Categories: Financial Literacy | Comments (0) | PermalinkNaked Puts (Part 1)
Posted by Mark on November 20, 2015 at 06:18 | Last modified: October 31, 2015 14:28Like I did for naked calls, today I will start to analyze my data on naked puts.
As an aside, I listened to a podcast this morning by a guy who supposedly trades for a living. He argued most traders fail because they cannot define their trading edge. He emphasized discretionary traders at one point because they are notorious for not having statistics to back their methodology.
I agree with that because usually with discretionary trading, parameters are not the same from one trade to the next. A set of guidelines might have a range over which action should be taken. An infinite number of possible trades may result depending on where action is ultimately taken and “gut instinct” is usually the deciding factor.
The goal of this post is to put some context around naked puts and try to determine whether they provide an edge.
I backtested from January 2, 2001, through October 2, 2015: 3,695 trades total.
87.8% trades (3,253) won.
12.2% trades (452) lost.
Mean days in trade was 27.6 with a standard deviation of 10.6.
Mean profit on 2,760 trades was $14,585 with a standard deviation of $1,929.
Mean days in winning trade was 29.7 with a standard deviation of 9.45.
Mean loss on 452 trades was $47,833 with a standard deviation of $17,551.
Mean days in losing trade was 17.1 with a standard deviation of 10.9.
Average trade: $6,970
Average annual profit: $92,257
Profit factor: 2.19
Really?
The relative magnitude of most of these dollar amounts is not so important. I backtested this with a position size four times larger than that of the naked calls.
One system statistic that I think speaks volumes is the 2.19. This is definitely worthy of a second look.
Categories: Backtesting | Comments (0) | PermalinkBacktesting Methodology (Part 2)
Posted by Mark on November 17, 2015 at 05:46 | Last modified: October 31, 2015 14:24A common approach to option backtesting often falls prey to insufficient sample size. The second big problem I see with most backtesting is potential invalidation by serendipity.
Yes serendipity, which is defined as “the occurrence and development of events by chance in a happy or beneficial way.”
Consider the following example. Suppose someone backtests a strategy over the last 10 years and starts each trade with 45 days to expiration (DTE). This would be a typical monthly trade similar to the naked calls strategy, which averaged 24.39 days/trade.
If the backtesting looks good then s/he is excited (a la “happy or beneficial way,” above) because s/he has encouraging results after studying 10 whole years!
Is it conceivable that if they started the trade with 44 DTE then the results might not look so good? Yes. It’s also possible the results might look downright ugly.
What if they started the trade with 46, 43, or 47 DTE? What about 40 DTE? 50 DTE?
People have tried to claim that certain days are the best/worst to trade and I suspect nothing is farther from the truth. Until I see such a claim statistically validated, I will consider all days to be equivalent. On a historical stock chart they all reduce to bars or candles. A study that performs well on 45 DTE better look good across a range of possible starting dates. If it doesn’t then go ahead and trade it with your money but I certainly will not be gambling with mine.
Put another way, if the other days aren’t looked at or included then I don’t think the backtesting amounts to a hill of beans. They should all be similar and if results look good on some days and bad on others then maybe the encouraging ones are simply due to chance.
This is why I backtested from 2001 through 2015 inclusive for a sample size approaching 3,700. I based my conclusions not on a particular starting date but on the average of all trades taken together.
Categories: Backtesting | Comments (0) | PermalinkBacktesting Methodology (Part 1)
Posted by Mark on November 13, 2015 at 06:44 | Last modified: October 31, 2015 12:41I don’t feel the backtesting statistics do the data justice without some explanation of the study methodology.
One of the most common approaches I have seen to option backtesting is to start trades on a particular day. I have seen people start backtested trades with 45 days to expiration, 36 days to expiration, or on the first trading day of every month.
One potential problem I see here is insufficient sample size. Traditionally, people could go back a number of years with a backtest and only have a sample size equating to 12 times the number of years. More recently with weekly options, sample sizes can be 4+ times greater but only if the strategy is a weekly strategy. Because WeeklysSM are considered by many to carry excessive risk, I believe monthly trades are much more common.
Exactly what is an adequate sample size, then? I’ll go with: 1. I don’t know; 2. It depends (on the particular situation). I really want to lean toward the latter and say “whatever sample size is sufficient for statistical significance.” The question would then be whether a statistically significant result is practically significant.
Based on my experience, traders are notorious for using insufficient sample sizes in backtesting and live trading. I’ve seen plenty of people backtest a monthly option trade for 1-3 years. With 12-36 occurrences, this hardly strikes me as sufficient! Perhaps my favorite example comes from traders trying to apply technical analysis (TA). For example, this comes courtesy of the Twittosphere (names blacked out to protect the “innocent”):
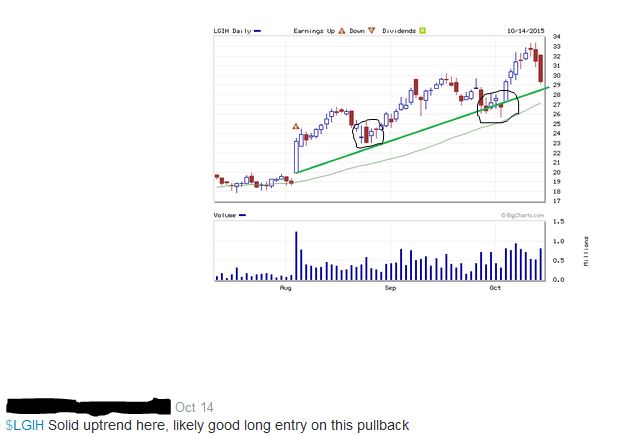
Obviously (according to TA) the long trade is “likely good” here because each of the previous times the stock has pulled back to the positively-sloped green line, it has moved higher. How many times was that? Look closely to make sure you count them all (circled): one, two… TWO!
Oh wait… only two?
How many days does it take to make a habit: 21? 30? 66? Certainly not two… you get the idea.
But wait: there’s more! I will continue in the next post.
Categories: Backtesting | Comments (1) | PermalinkNaked Calls
Posted by Mark on November 10, 2015 at 07:14 | Last modified: October 31, 2015 12:18I have spent many hours backtesting naked calls and I now want to analyze these data. The question I ultimately look to answer is whether this trading approach offers any edge.
I backtested from January 2, 2001, through September 21, 2015: 3,695 trades total.
74.7% trades (2,760) won.
25.3% trades (935) lost.
Mean days in trade was 24.39 with a standard deviation of 11.87.
Mean profit on 2,760 trades was $2,994.65 with a standard deviation of $835.
Mean days in winning trade was 25.92 with a standard deviation of 11.12.
Mean loss on 935 trades was $9,601.91 with a standard deviation of $3,420.
Mean days in losing trade was 19.87 with a standard deviation of 12.82.
Average trade: -$192.84
Average annual loss: -$2,886.20
Profit factor: 0.92
To say “this does not seem very encouraging” is understatement of which even Ernest Hemingway would be proud.
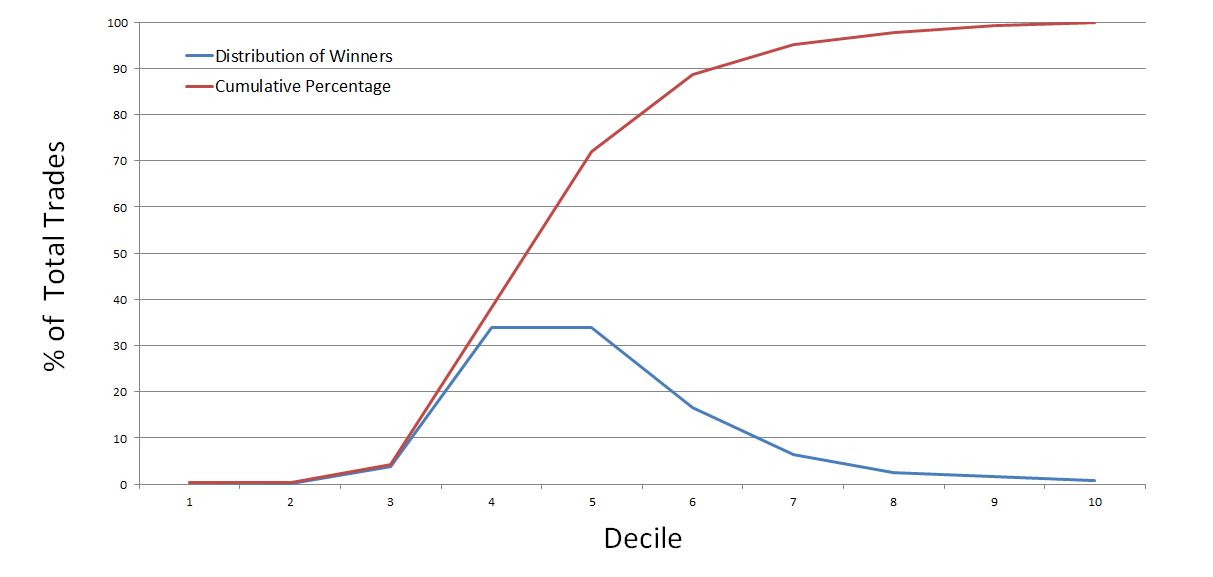
The graph below shows the distribution of winning trades:
The graph below shows the distribution of losing trades:
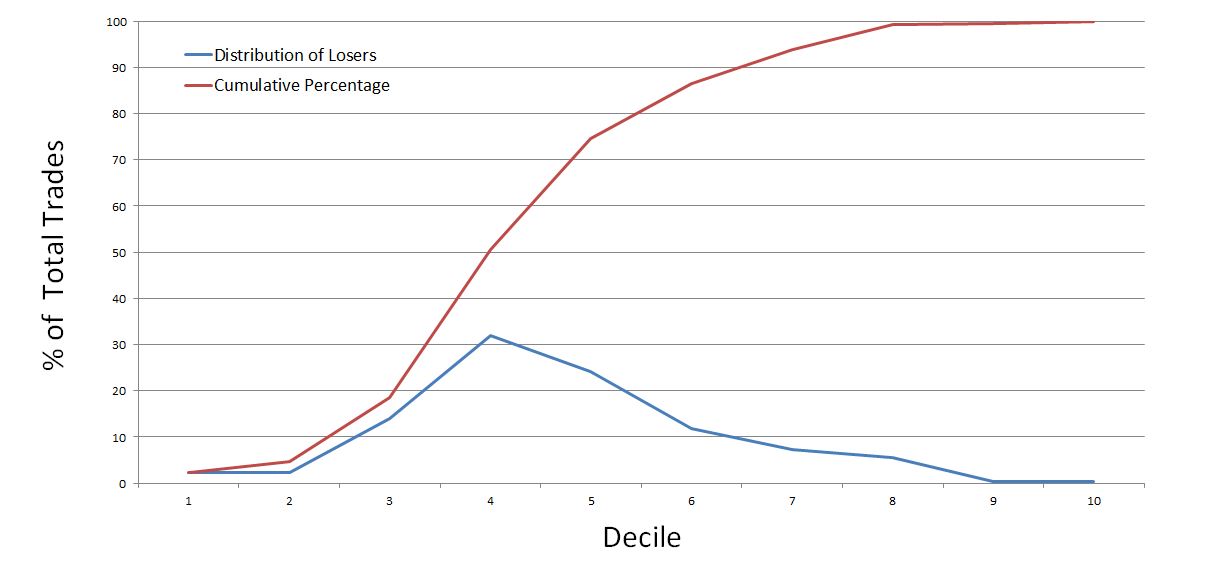
Do you see anything here that might offer even the slightest of hope?
I do find it interesting that the four deciles of largest losses (in excess of $13,584 per trade) account for less than 14% of the losing trades.
Intuitively, I’d like to see this significantly larger than the four deciles of largest gains (in excess of $4,624 per trade) but those account for a comparable amount at 11.4% of the winning trades.
A couple other observations further dim the light on hope. First, the losses are not maximum adverse excursion (MAE): the practical statistic that really matters. Second, it’s important to note this was an end-of-day backtest, which means results can be lumpy. A trade can go from decile 2 to decile 7-10 in a single day.
I may run the MAE analysis later but I really have little hope for a system with a negative expectancy to start (profit factor < 1.0).
Categories: Backtesting | Comments (3) | PermalinkUnderstanding Dividends (Part 3)
Posted by Mark on November 6, 2015 at 05:11 | Last modified: October 29, 2015 09:11Let’s go back to the theory that capital appreciation and dividend income are two sides of the same coin.
Were this theory found to be true, something would strike me as very wrong because the financial industry significantly emphasizes a difference between these investment objectives.
Even in this case, I did think of one marketable difference in favor of dividends. I could, in effect, make a non-dividend stock into a dividend-paying stock by periodically selling shares for cash. I would have to pay a commission with each stock sale, though. The commissions amount to money lost and I don’t see a clear way around it. I wrote earlier about synthetic equivalents in Finance. Equivalents are truly identical whereas the commissions make this different. I could try to argue “companies incur significant administrative fees when paying dividends to all those shareholders on a periodic basis and these fees cut into their cash on hand, make the company worth less, etc.,” but: 1) as a total percentage of cash on hand, this is probably minuscule; 2) to suggest the decreased cash commands a lower stock price is another theoretical concept and one I doubt could even be tested (too small to detect).
So for someone who does need money periodically to pay the bills, even in the hypothetical case that dividends are nothing more than future capital appreciation realized right away, I do see benefits to that dividend check. Is this worth the significant growth/income difference affirmed by the industry with regard to the suitability standard? I think that is highly debatable but I would be much more enraged about the construct if I could come up with no difference at all.
And because I no longer believe dividend income and capital appreciation to be the same anyway, once again “FAHGETTABOUDIT!” is in order.
Categories: Financial Literacy | Comments (0) | Permalink