Naked Puts (Part 2)
Posted by Mark on November 23, 2015 at 07:27 | Last modified: October 31, 2015 14:28In my effort to put more context behind the trade, I found something dramatically different with naked puts than I did with naked calls.
As previously discussed, I’m trying to understand whether the trade offers an edge. Putting context behind a trade is an attempt to better understand what I can reasonably expect in terms of critical trade parameters like profit/loss, drawdown, and total risk.
Below is a graph of cumulative profit/loss across all trades from 1/2/01 through 9/18/15:
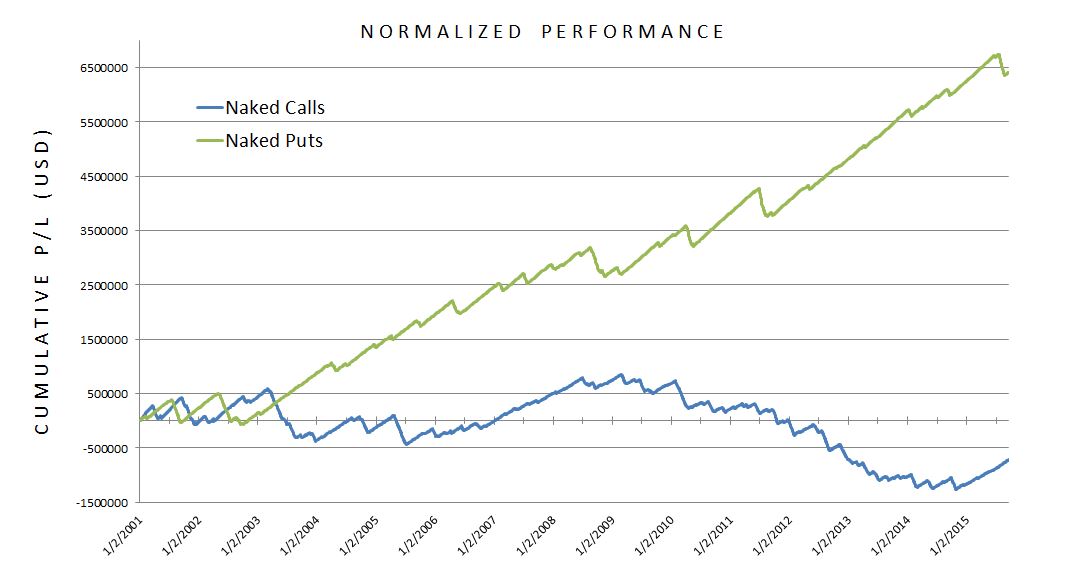
Normalized performance means I adjusted numbers for position size difference.
As an initial impression, I would not want to do the naked calls. Period. In following along that blue line, I see no reason to hold out any hope for consistent, long-term profitability.
The naked puts are a totally different story. The green line is, for the most part, beautiful and pretty much what I would expect for a bullish trade. If I highlight the market corrections:

Now we can clearly see [circled] September 11 (2001), the market downturn of 2002, the 2008 financial crisis, the Flash Crash (5/10/10), summer 2011, October 2014 (small), and the recent correction this past August.
The naked call trade is flat to lower with the market mostly up over the last 14+ years. I did expect to at least see profitability there, though, because of the margin of safety the trade affords.
The naked put equity curve, on another hand, seems amazingly resilient. I’m not happy with the first two years but that is to be expected from a bullish trade in a bear market.
So what does all this mean? Is there edge? Do I know yet? What context is still missing?
One thing that would help is comparison to a benchmark. I will move in that direction next time.
Categories: Backtesting | Comments (1) | Permalink