Option Volatility and Pricing (Part 2)
Posted by Mark on November 27, 2013 at 06:12 | Last modified: January 20, 2014 09:35In my last post, I took a detour to explain some basics about option pricing and volatility.
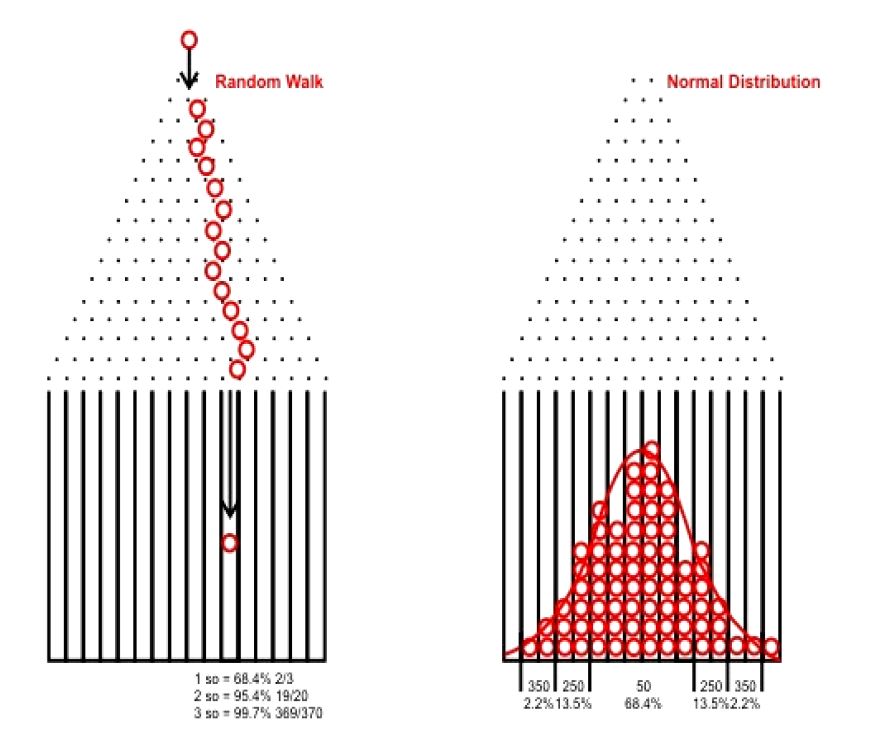
In that discussion, I showed an experimental 100-trial simulation of the Price and Right “Plinko” game, which simulates a random walk. If we run many such 100-trial simulations and combine the results then we will see something like this:
These chips are much like stocks, which have a near-equal chance of going up or down on any given day. Most option pricing models assume future stock price to be distributed in this fashion. Since people trade based on these pricing models and since trading theoretically affects price movement, it seems logical that future prices will more or less follow the Normal distribution (bell curve as shown above).
As I write this, two questions pop into mind.
First, do stock prices really follow these tendencies?
We could conduct a backtest to answer this question. We might randomly select a large number of stocks and note the average IVs. We could then look at price changes over a predetermined time interval and convert those to SDs. If the theory holds then the SD distribution should approximately follow the bell curve.
This backtest is much easier said than done. We might want to look at some different market environments. We might want to diversify across sectors or asset types. We should be sure to include stocks that have become worthless (corporate bankruptcies). The considerations are numerous.
Assuming the bell curve is an accurate description for stock movement, my second question is whether that movement is randomly distributed because of the pricing models or are the pricing models as they are because of the way price movements distribute? This is a “chicken or the egg” question that may not have an answer.
I will continue this discussion with my next post.
Categories: Option Trading | Comments (1) | Permalink