Option Volatility and Pricing (Part 1)
Posted by Mark on November 25, 2013 at 07:12 | Last modified: January 17, 2014 13:23The last post spawned a couple other thoughts that are each worth at least a few hundred words to discuss. Today I want to take a detour and complete what I was talking about with regard to the statistical bell curve.
This might be review for anyone who has studied options in the past.
When I posted the bell curve and did the math to calculate probabilities of future AAPL stock prices, a thought occurred to me: “what makes me think I can whip out a statistical bell curve and say options pricing has anything to do with it?” People who have studied stock investing may get price targets through fundamental analysis or sometimes through technical analysis (e.g. measured move) but when those prices will be realized is not emphasized too much. Option pricing actually affixes time to a range of potential stock prices and probability. How does that all work?
The answer is that most any option pricing model starts with Random Walk theory. Option pricing models involve probabilities that attempt to determine the chance an option will expire in the money based on a number of known parameters (e.g. put or call, time to expiration, implied volatility of the market, dividend yield, interest rates, strike price, stock price). Random Walk theory is well illustrated by the Plinko game of “Price is Right” fame:
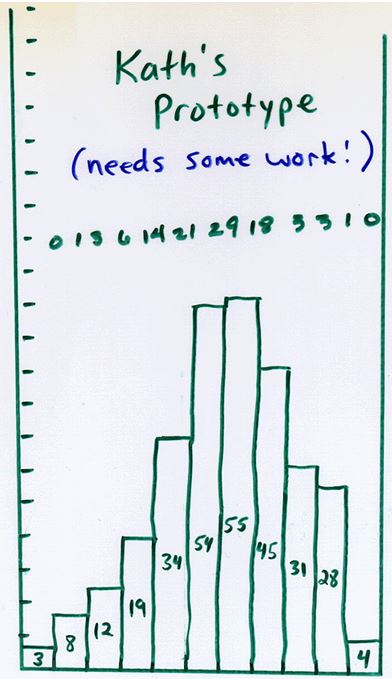
The contestant up top can choose anywhere across the “PLINKO” lettering to drop her chip. Ultimately, she hopes for it to land in the middle at the bottom where she will win $10,000. When she drops the chip, it has a random chance of going to the right or left at each peg. If we do this many times then what does our distribution of coins at the bottom look like?
This website shows one such simulation:
I will continue this discussion in the next post.
Categories: Option Trading | Comments (1) | Permalink
