2012 Performance Evaluation (Part 2)
Posted by Mark on February 12, 2013 at 06:50 | Last modified: February 6, 2013 16:25In the absence of co-workers and a boss, the biggest reason I maintain this blog is to keep myself accountable. To that end, I presented equity curves of my performance since inception (2001) in http://www.optionfanatic.com/2013/02/11/2012-performance-evaluation-part-1/. The current blog series represents my annual performance review and a tool to tweak my trading plan, if necessary, to stay on track with long-term goals.
Because my time commitment and overall approach have been highly variable over the last 11+ years, I will not try to make generalizations about the whole. This would be like comparing apples to oranges.
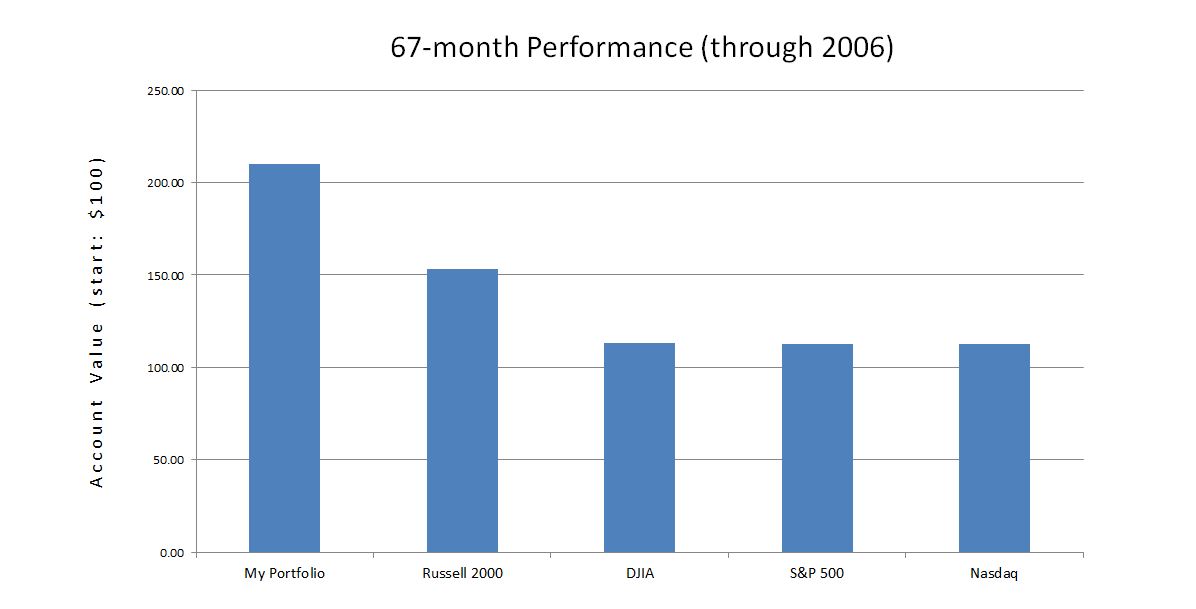
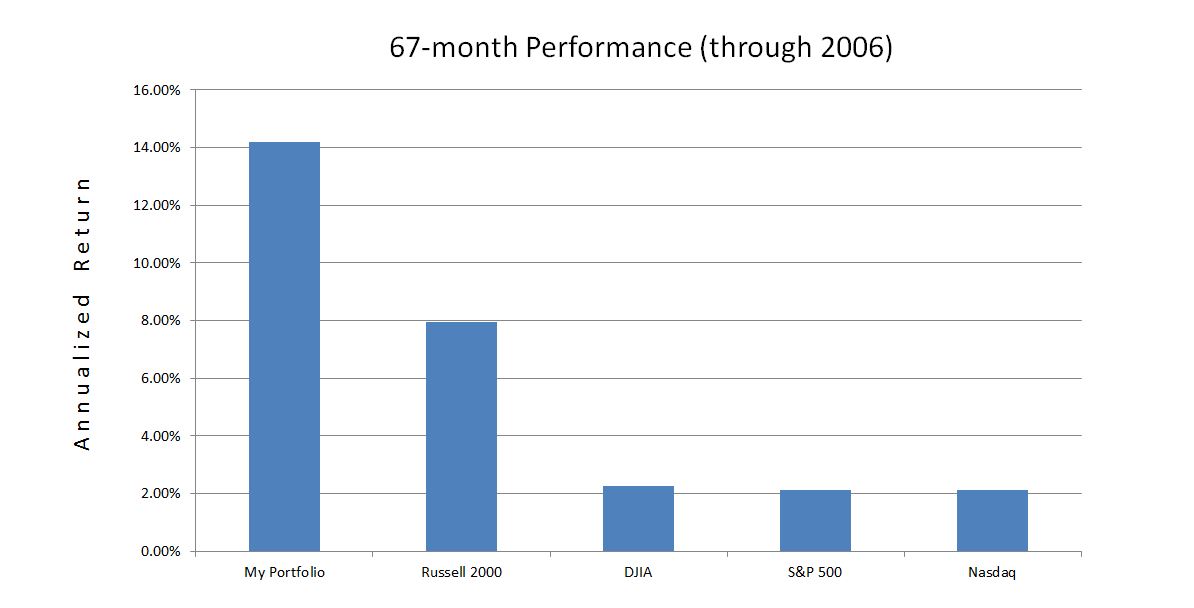
From June 2001 through the end of 2006, I worked full-time in pharmacy. My investment plan included a set of stock screens that I ran on a monthly basis. My net return during these years is shown below:
These years included sharp selloffs during 9/11 (2001) and 2002 along with bull market conditions in 2003 and 2004-2006. The maximum drawdown, faced only five months into my investing career, was 32%: larger than that seen by the Russell 2000 and DJIA indices. In the end, I did manage to outperform the Russell 2000 by 6.2% per year and the other three indices by about 12% annually.
In 2007, I started trading options in earnest. I was up 36% for the first five months of the year vs. the leading index (Russell 2000), which was up only 6%. By year’s end, I gave back all these profits and more. In the process, I learned an important lesson about luck. Because good luck may sour, being in a position to limit losses when the market turns against me is more important than being able to make money when the market goes my way. This is good risk management that is essential for success because the degree of loss will usually outpace the degree of gain when all other factors remain equal.
I will continue this analysis in my next post.
Categories: Accountability | Comments (1) | Permalink
