Blog Reset (Part 2)
Posted by Mark on February 26, 2013 at 05:24 | Last modified: July 25, 2013 11:40As mentioned here, I was 29 posts behind my twice-weekly goal on September 8 of last year. With the exception of a couple weeks at the beginning of January, I have pretty much posted every trading day since. As of today, I am roughly 14 posts ahead of schedule.
With a target length of 300 words per post, I will aim to post twice weekly going forward. This blog keeps me on track with my goals and is a way to keep me accountable in lieu of a manager or supervisor that I used to have in my corporate days as a pharmacist.
Categories: Accountability | Comments (0) | Permalink2012 Performance Evaluation (Part 9)
Posted by Mark on February 22, 2013 at 05:29 | Last modified: February 13, 2013 05:20In http://www.optionfanatic.com/2013/02/20/2012-performance-evaluation-part-8/, I detailed the loss filter (LF) concept and showed performance results with and without the LF. I then went on to describe two potential flaws with the analysis.
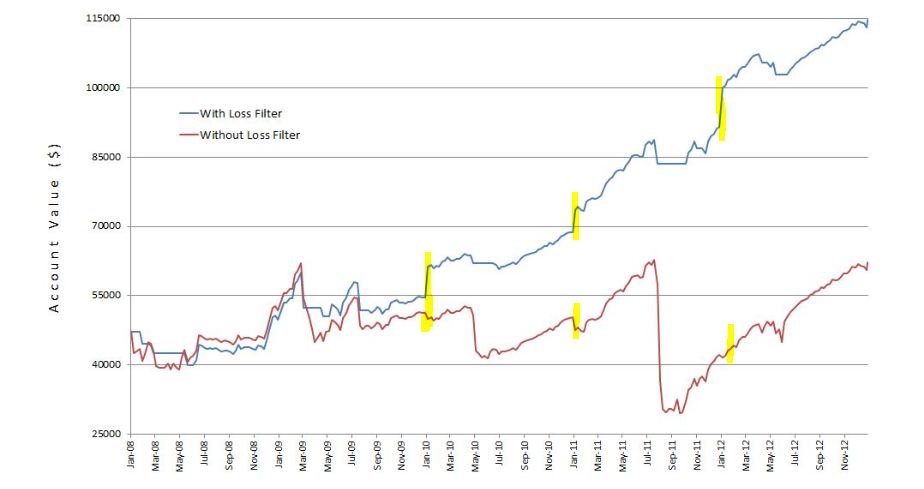
As mentioned previously, when I see shockingly impressive results I tend to scrutinize closely to see if mistakes, either deliberate or inadvertent, have been made. Did you look closely at the graph in the previous post? If so then you might have seen what I did:
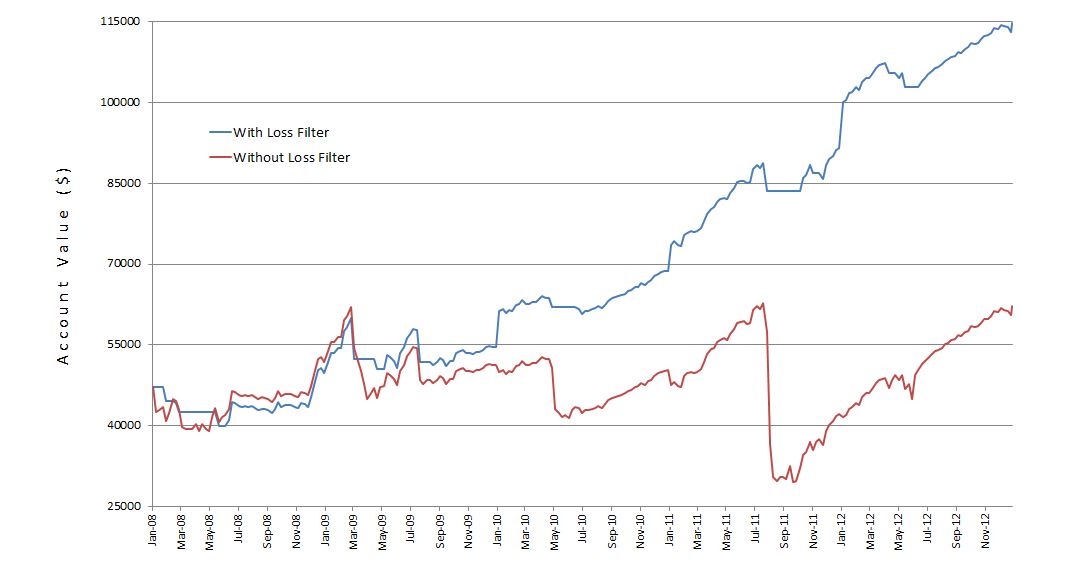
When activated, the LF keeps me out of the market, which results in a flat equity curve. The red line should always be gaining when the blue line is gaining because the red line is always in the market (no LF). Highlighted in yellow above are three occurrences where the blue line was gaining and the red line either gained much less or lost.
As it turns out, I made a mistake in the spreadsheet at year-end 2009, 2010, and 2011!
I will continue this analysis in my next post.
Categories: Accountability | Comments (1) | Permalink2012 Performance Evaluation (Part 8)
Posted by Mark on February 21, 2013 at 06:41 | Last modified: February 13, 2013 05:21In http://www.optionfanatic.com/2013/02/19/2012-performance-evaluation-part-7/, I discussed using the equity curve as a signal to stop trading when it crosses below its own moving average. Another concept I have been considering is to exit the market in favor of paper trading when I have an unusually large weekly drawdown and to resume live trading once consecutive weekly paper gains are posted.
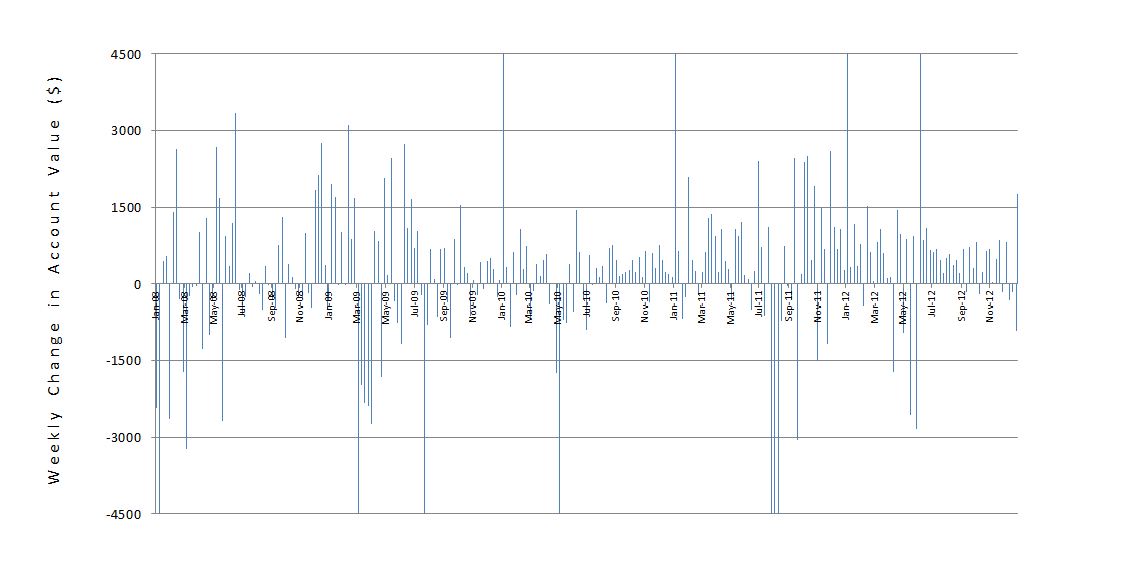
Here is a graph of account value weekly change:
Since 2008, I have made money in about 64% of all weeks. The largest losses seem to be somewhat clustered, though. Suppose I switch to paper after a weekly loss over $3,000 and resume live trading after back-to-back weeks of paper profit The following graph shows the equity curves with and without this “loss filter” (LF):
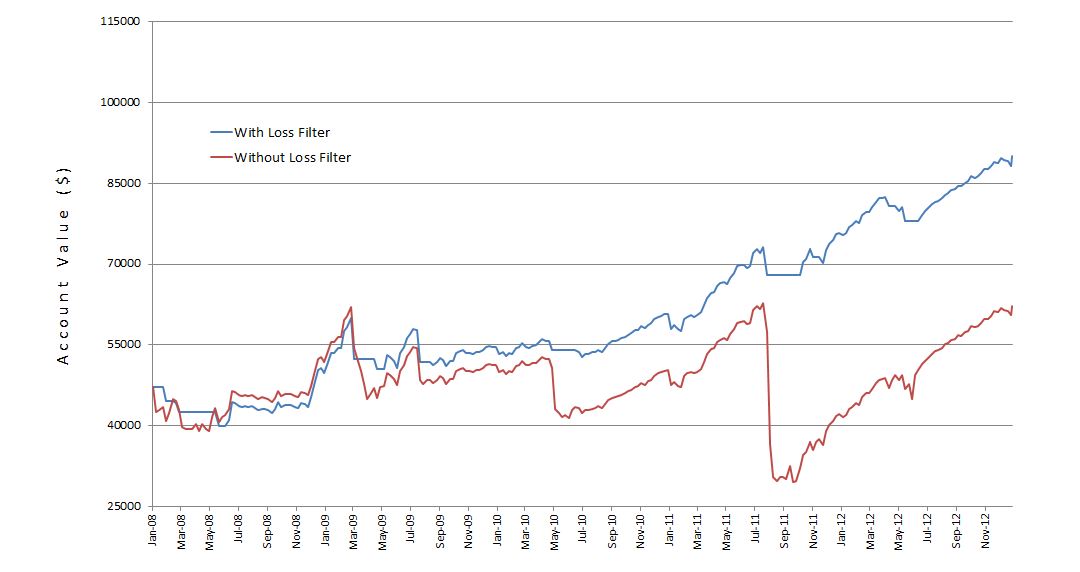
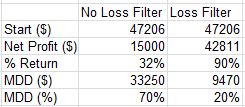
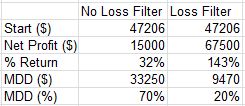
Note the significantly reduced drawdowns–especially March 2009, the Flash Crash, and August 2011. With that ball and chain cut, the profits were really able to run:
Whenever I see shockingly impressive results like these, I want to scrutinize the methodology for potential flaws. I see two such flaws with this analysis. First, I am analyzing a sample of discretionary rather than systematic trading. Position size has varied in an unpredictable fashion and the bigger weekly changes may have occurred when position size was extremely large. With a systematic approach where position size is more controlled, this may not have occurred and the LF may not have been triggered. On the flip side, the hypothetical account did not outperform in all instances where the LF was triggered. I should backtest the strategy in a more systematic fashion and then assess the impact of the LF.
A second potential flaw is arbitrary selection (-$3000 for the LF and two consecutive weeks of profitability) per my post http://www.optionfanatic.com/2012/12/12/flushing-out-the-arbitrary/. I should study the parameter space for plateaus rather than spikes by backtesting different values of the LF and number of consecutive profitable weeks required to resume live trading.
Categories: Accountability | Comments (0) | Permalink2012 Performance Evaluation (Part 7)
Posted by Mark on February 20, 2013 at 06:57 | Last modified: February 13, 2013 05:22As discussed in my last post (http://www.optionfanatic.com/2013/02/18/2012-performance-evaluation-part-6/), 2012 was calm for stocks as compared to any of the preceding four years. Give me any tame market and my account should flourish. Indeed, last year I returned over 53% when the best-performing index returned under 16%. What a windfall! Don’t you just wish I managed your money? Do you want to be like me?
Not just yet.
As for the other two questions, no and no.
I cannot depend on quiescence in order to succeed. I will only be a good trader when I can make money in calm markets and avoid losing big in violent ones. With the exception of 2008, I have yet to demonstrate success with the latter.
I now want to adjust my focus from monthly to weekly performance numbers. The basis for this discussion involves tracking account value alongside its moving average (MA). The MA serves as a “loss filter” by signaling to stop trading real money in favor of paper trading when the equity curve crosses below the MA. When the hypothetical account value crosses above the MA then trading may resume with real money.
While I think this concept has merit, I worry about the potential for curve fitting. I would not want to optimize and pick the best MA period without surveying the parameter space to make sure good results are seen with neighboring values. I also worry about sample size. I have less than five years of weekly account values available and in that time, I may only have a handful of instances where account value has crossed its MA. If I don’t have enough cases to form a valid sample then the door is left open to curve-fit results and decreased probability of future profit with real trading.
In the next post I will discuss a variation on this theme.
Categories: Accountability | Comments (0) | Permalink2012 Performance Evaluation (Part 6)
Posted by Mark on February 19, 2013 at 06:38 | Last modified: February 13, 2013 05:23For the first time in this blog, I am reviewing my performance from 2001 to the present. In http://www.optionfanatic.com/2013/02/15/2012-performance-evaluation-part-5/, I reviewed 2011 and began discussion of two changes made in my trading following the summer market crash.
Aside from not trading until after 3:30 PM, the second change I have adopted is a stricter limit on position sizing. Although it is difficult to nail this down with certainty, the largest long position size (by number of contracts) I would carry today is about 40% of that carried in 2010 and about 70% (about 60% in dollar terms) of that carried in 2011. I have a maximum monthly long contract limit in mind and I prefer to start out trading 33-67% of that limit. In most months I do not even reach the limit.
Position sizing has been restricted on the short side as well. I would estimate my acceptable short contract limit to be 60% or less than what I carried in 2010-11.
One thing that still concerns me is a tendency to see position size creep higher from one month to the next. This reflects difficulty accepting loss. Rather than close out positions and realize loss, I look to roll positions for equal or greater credit. This will boost profitability in a tame market but lead to suffering when the bull or bear really gets angry.
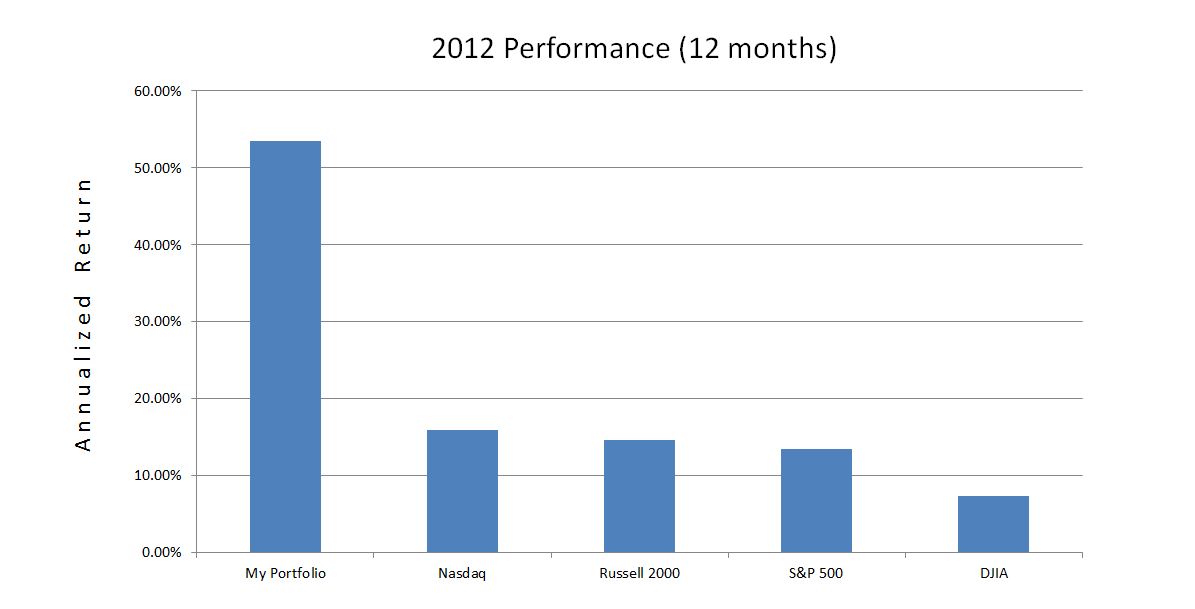
In 2012, the Russell 2000 experienced two corrections over 10% but still moved higher by year-end. For the first year in four, I outperformed:
With a 53% return and MDD of only 3.6%, this was a dream year for my portfolio. This was a relatively tame year for the markets, however, as the largest MDD of any major index was only 8.2% (Nasdaq). I give much more credit to the tame market than to my own skill for the exhilarating performance. While I feel the updated trade guidelines have helped to stabilize my portfolio, it will take the next significant market correction to truly make an apples-to-apples comparison with what happened in 2010 and 2011.
Categories: Accountability | Comments (0) | Permalink2012 Performance Evaluation (Part 5)
Posted by Mark on February 15, 2013 at 06:13 | Last modified: February 8, 2013 06:32As my own boss, I am conducting an annual review in this series of blog posts. In http://www.optionfanatic.com/2013/02/14/2012-performance-evaluation-part-4/, I continued with evaluation of 2010 and 2011. I now want to spend some additional time focusing on 2011.
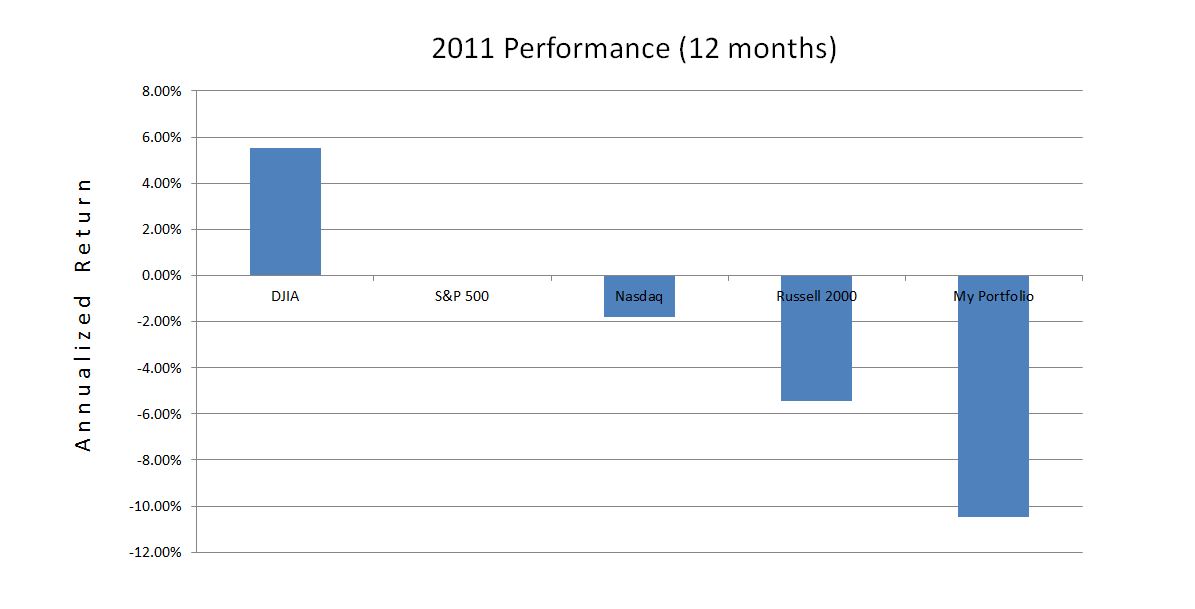
As mentioned, 2011 was the fourth time I had been forced to exit positions turned against me because of excessively large position sizing. In previous years, I escaped with relatively modest losses. In 2011, however, my maximum drawdown (MDD) exceeded 50%. That is entirely unacceptable when trading other people’s money, which is one reason why I don’t, but also unacceptable when trading my own. I’m running a business here and losing that much money is the fast track to going “belly up.”
2011 was the third consecutive year of underperformance relative to the major indices. Despite the ugly MDD, I managed a 42.5% rebound from the year’s low, which landed me down “only” 10.5% for the year. I’m probably still standing for this reason alone.
In an attempt to turn things around, I have attempted to implement two major changes. First, I have resolved to avoid trading until after 3:30 PM. On too many days, I got scared by seeing strong market moves in one direction early only to see those moves reverse by day’s end. Usually when I made a trade earlier in the day I was smacking myself at the close wondering why I wasn’t more patient. This is overtrading and it may be labeled as such only in retrospect.
To facilitate this end-of-day approach, on many trading days since summer 2011 I have not even looked at the market until 3:30 PM. Over the next 15 minutes I typically catch up with the market’s intraday movement and then place trades (if necessary) at 3:50 PM or later. This has helped me be less reactive to random noise responsible for so much market activity.
I will continue this analysis in my next post.
Categories: Accountability | Comments (1) | Permalink2012 Performance Evaluation (Part 4)
Posted by Mark on February 14, 2013 at 05:34 | Last modified: February 7, 2013 13:12In the last few posts, I have been conducting my 2012 annual review. In the future, this will take only a day or two. Since I have never blogged about it before, however, this time I am reviewing back to inception. I reviewed 2008 and 2009 in http://www.optionfanatic.com/2013/02/13/2012-performance-evaluation-part-3/. Today I will continue with 2010-11.
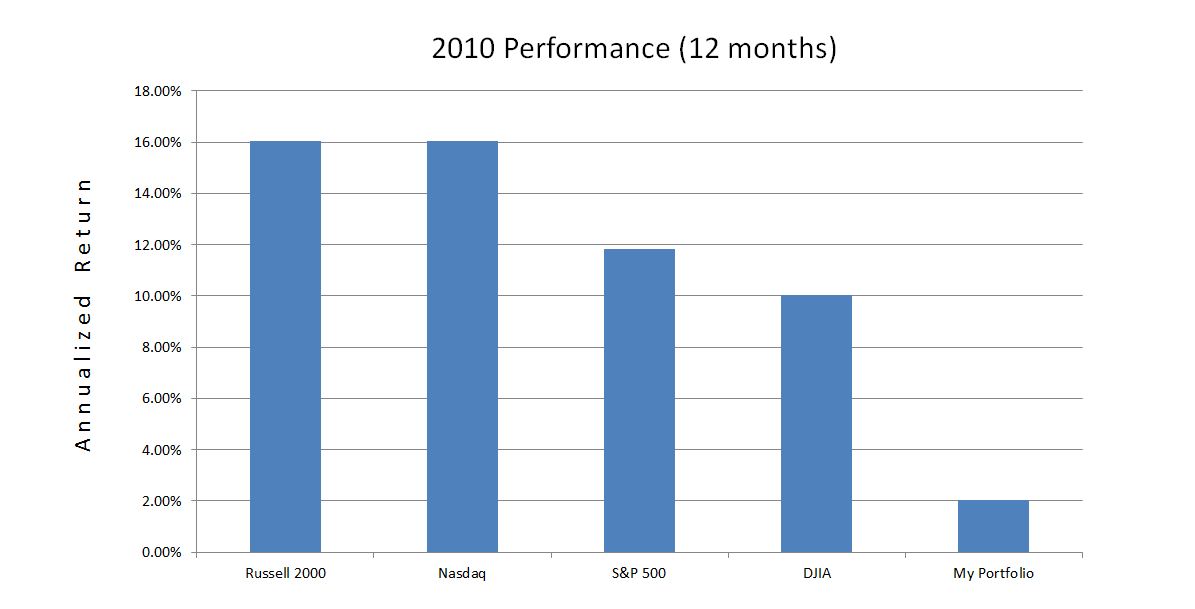
By the numbers, 2010 went like this:
May 6, 2010, was the infamous Flash Crash where the DJIA dropped over 1000 points in one hour. May capped my MDD for the year of 20.5%. In the last post, I said this would be an acceptable annual MDD if it never got any worse. The largest MDD seen in the major indices for 2010 was 13.9% (Russell 2000), though. That makes my MDD seem a bit less heartening.
As market volatility soared from April to May of 2010, my portfolio hemorrhaged cash. The psychic pain became too much to bear on May 6, when I closed the last of my long positions. This may sound familiar because it is: a third time being caught trading too large. As is often the case when trading too large, I was forced out at the absolute worst time (MDD).
2011 was very similar to 2010:
Again, this year brought a more severe mid-year market crash (Russell 2000 down 24.3% in 2011 vs. 17.1% in 2010 over roughly a 1-month time period), albeit without the magnitude of volatility increase seen during the Flash Crash (volatility spiked 65.2% in 2011 vs. 172% in 2010 over roughly a 1-month time period). I was camping at the time (with my laptop), and was caught with my pants down carrying too large a position for–what time is this? 2007, 2009, 2010… oh yeah, the FOURTH time. In prior posts, I have said that a 20% maximum drawdown (MDD) from one year to the next would be acceptable to me. In 2011, my MDD was 50.1%. Contrast this with the largest broad based index MDD of 25.6% and you have a recipe for disaster.
The analysis will continue with my next post.
Categories: Accountability | Comments (1) | Permalink2012 Performance Evaluation (Part 3)
Posted by Mark on February 13, 2013 at 04:30 | Last modified: February 7, 2013 05:24This blog series represents my 2012 annual review. In http://www.optionfanatic.com/2013/02/12/2012-performance-evaluation-part-2/, I discussed my performance through 2007.
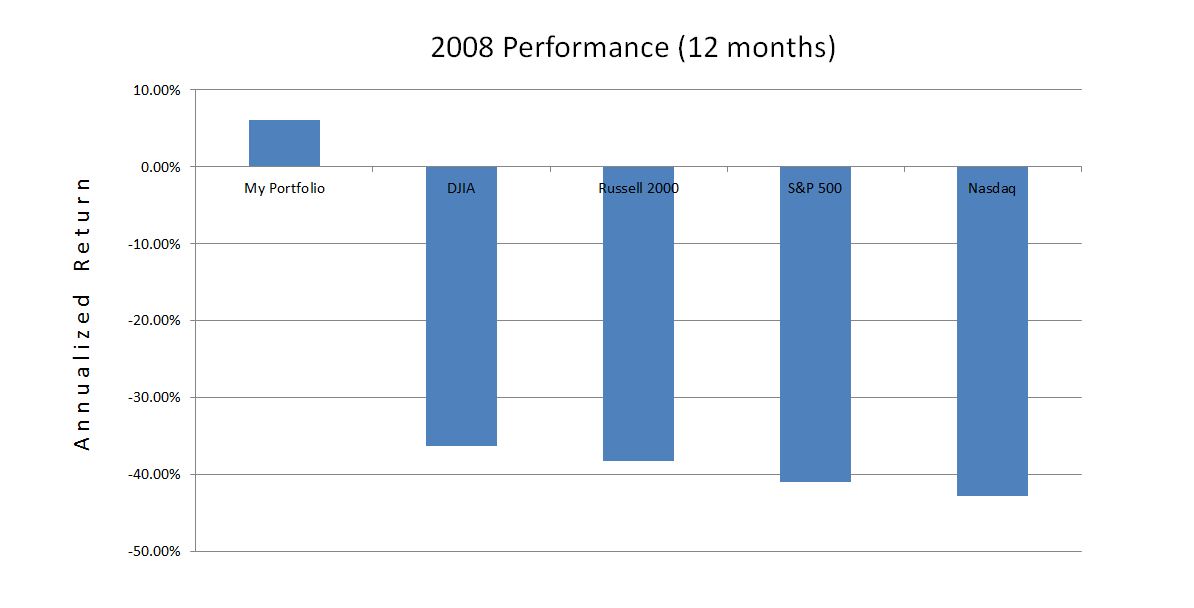
2008 was my introduction to full-time trading. Faced with a market in correction, I traded much of the year with reduced position size:
This was not a cakewalk as my maximum drawdown (MDD) hit 20.9% in March. While discomforting, if this were the worst MDD ever encountered on a year-to-year basis then I would be content.
My MDD was only about half that seen in the major indices. I capitalized on much of the October-November tumble by purchasing put spreads. I remember spending hours in front of the screen with my mouth propped open as I watched the horror of a market in free fall. I felt bad for those who could only watch big retirement savings fly out the window from one day to the next because “buy and hold” was the mantra espoused by the financial industry for years and years.
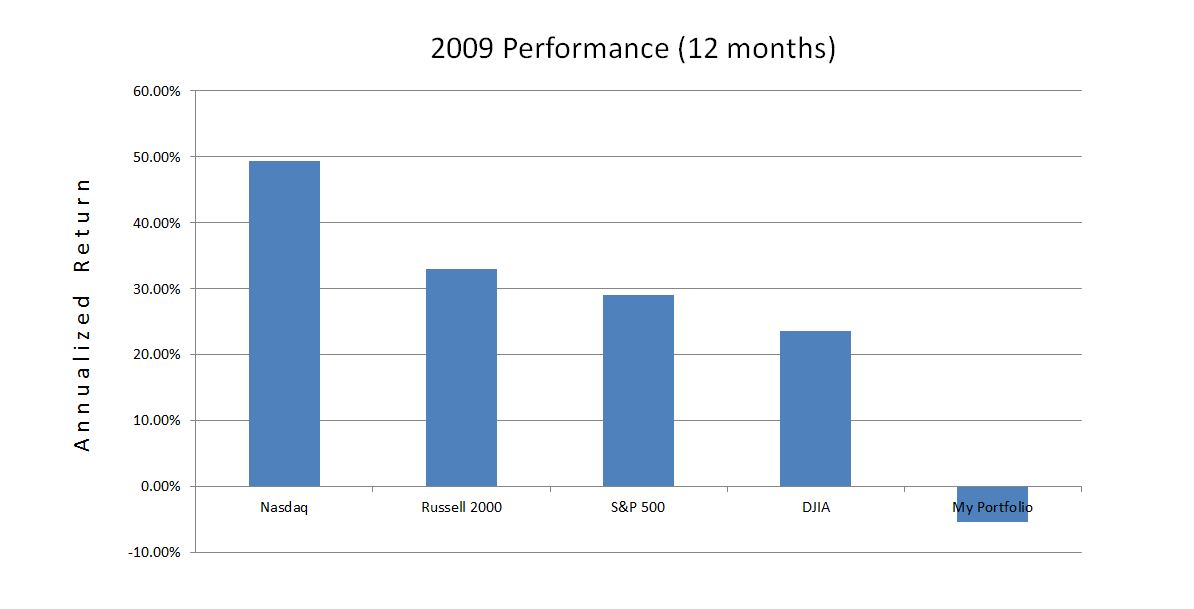
My good fortune reversed in 2009:
What killed me in 2009 was a 27.7% MDD, which occurred in the span of two months. This was another case of trading too large and being caught with my pants down when the market made its third and final thrust lower. I traded small for the remainder of the year as I reassessed my trading plan.
In retrospect, what frustrates me is the need to experience this lesson multiple times before I learn it. My first lesson was in 2007 when a couple sharp selloffs turned my huge, long positions against me. In 2009, I saw this happen once again.
I will continue the analysis in my next post.
Categories: Accountability | Comments (1) | Permalink2012 Performance Evaluation (Part 2)
Posted by Mark on February 12, 2013 at 06:50 | Last modified: February 6, 2013 16:25In the absence of co-workers and a boss, the biggest reason I maintain this blog is to keep myself accountable. To that end, I presented equity curves of my performance since inception (2001) in http://www.optionfanatic.com/2013/02/11/2012-performance-evaluation-part-1/. The current blog series represents my annual performance review and a tool to tweak my trading plan, if necessary, to stay on track with long-term goals.
Because my time commitment and overall approach have been highly variable over the last 11+ years, I will not try to make generalizations about the whole. This would be like comparing apples to oranges.
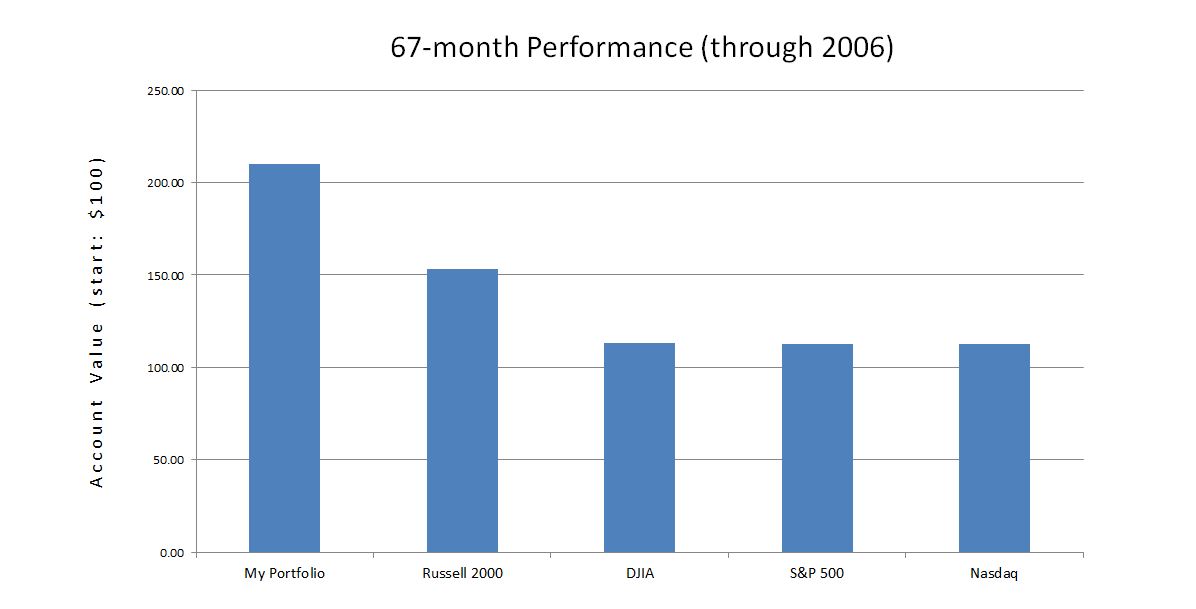
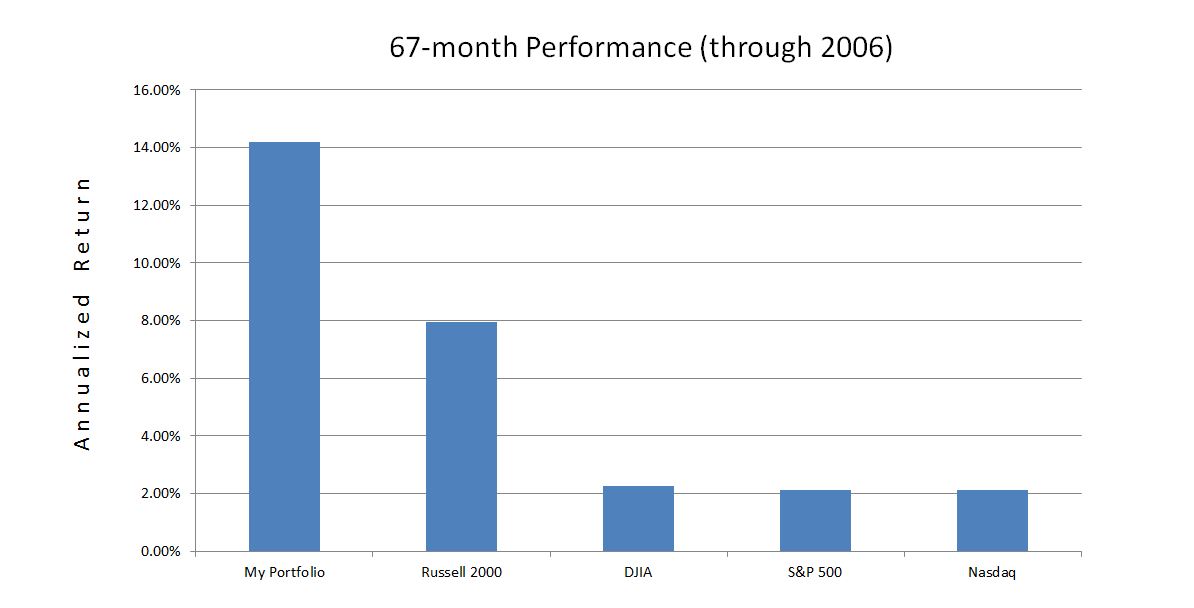
From June 2001 through the end of 2006, I worked full-time in pharmacy. My investment plan included a set of stock screens that I ran on a monthly basis. My net return during these years is shown below:
These years included sharp selloffs during 9/11 (2001) and 2002 along with bull market conditions in 2003 and 2004-2006. The maximum drawdown, faced only five months into my investing career, was 32%: larger than that seen by the Russell 2000 and DJIA indices. In the end, I did manage to outperform the Russell 2000 by 6.2% per year and the other three indices by about 12% annually.
In 2007, I started trading options in earnest. I was up 36% for the first five months of the year vs. the leading index (Russell 2000), which was up only 6%. By year’s end, I gave back all these profits and more. In the process, I learned an important lesson about luck. Because good luck may sour, being in a position to limit losses when the market turns against me is more important than being able to make money when the market goes my way. This is good risk management that is essential for success because the degree of loss will usually outpace the degree of gain when all other factors remain equal.
I will continue this analysis in my next post.
Categories: Accountability | Comments (1) | Permalink