Sizing Risk (Part III)
Posted by Mark on May 2, 2012 at 23:34 | Last modified: October 1, 2012 05:52Sizing Risk is a common trading plan element that can pose a challenge to consistent profitability.
As discussed in Part I (http://www.optionfanatic.com/2012/04/26/sizing-risk-part-i/), these are scaling trading plans with a profit target of 15% and max loss of 20%. Suppose $10,000 is allocated per tranche for up to three tranches. The trade will then profit $1,500, $3,000, or $4,500–fifteen percent–depending on how many tranches are placed. When the trade loses, it will usually be after completely scaling in: 20% of $30,000 is $6,000 lost.
This monthly trade will therefore have to profit at least 75% of the time to be profitable. If the trade wins eight months out of 12 and averages two tranches for each winning month then in one year it will make 8 months * $3,000/month = $24,000 and lose 4 months * $6,000/month = $24,000. If the trade only wins seven months and loses five months then the annual return will be -30%. Should it have a tough year and lose exactly as often as it wins, the annual return will be -60%, which is nothing less than a good recipe for grounding an account into hamburger meat.
As discussed in my posts on the naked put selling strategy (http://www.optionfanatic.com/2012/03/25/the-naked-put-part-iii/), a common worry amongst traders is to have one catastrophic loss that wipes out many profitable months. Sizing Risk teaches us that making too little in the winning months can be just as harmful to overall returns as catastrophic losses but is much more frequently overlooked.
Tags: income trading | Categories: Money Management, Option Trading | Comments (0) | PermalinkSizing Risk (Part II)
Posted by Mark on April 30, 2012 at 13:31 | Last modified: April 30, 2012 15:02In Part I on Sizing Risk (http://www.optionfanatic.com/2012/04/26/sizing-risk-part-i/), I described a scaling strategy that aims for a 15% profit target and 20% max loss. Because allocated capital may remain on the sidelines, the strategy actually aims for a 10% average profit target with 20% max loss. This lowered profit target raises a challenge to profit factor because it loses even more in bad months than it profits in good months.
If the trade reaches 15% profit on 33% or 67% of allocated capital then why not hold the trade until it reaches 45% or 22.5% profit respectively, which would be the same net profit as 15% on 100% of allocated capital?
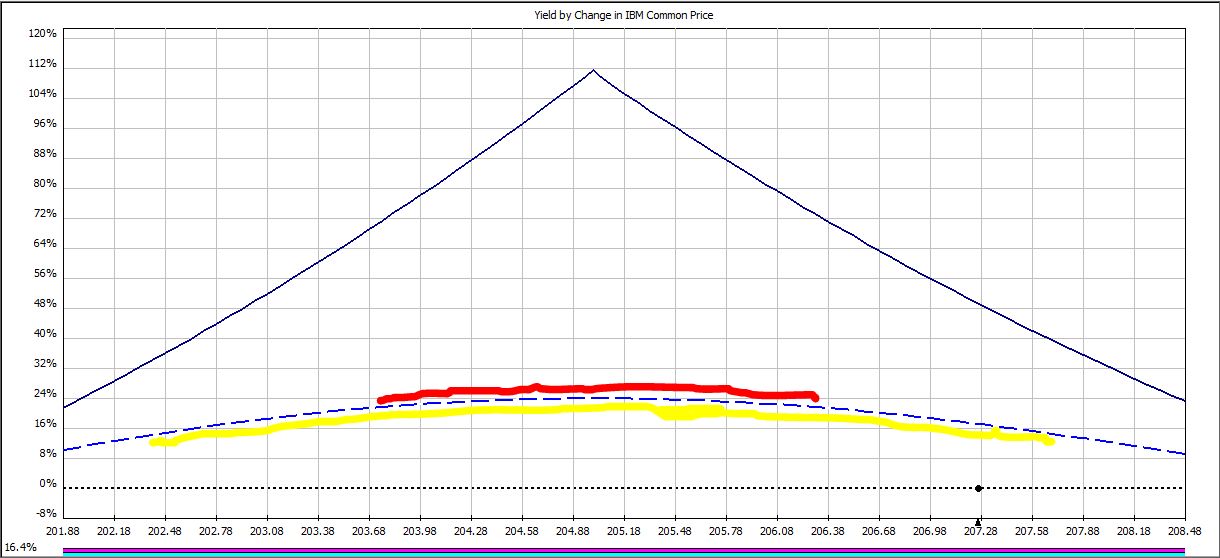
On certain days, a profit target may be hit when IBM trades within a price range. For example, to hit the 22.5% profit target on trade day 12:
IBM must trade within a range only 22% as wide (red line) as it must trade to hit the 15% profit target (yellow line).
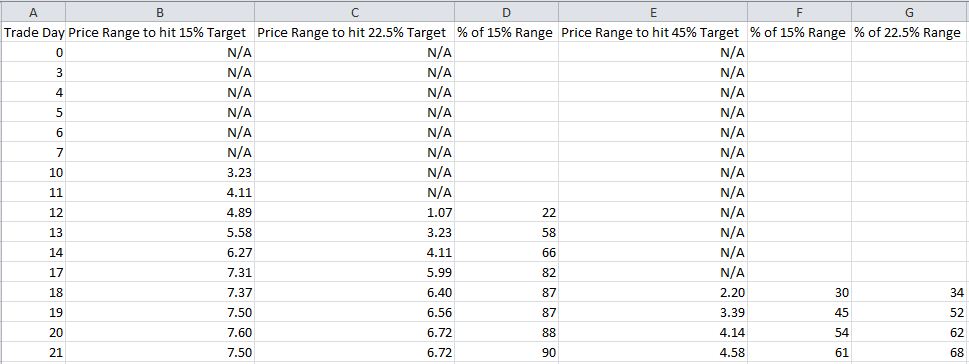
In the table below, Columns B, C, and E describe the range of price ($) in which IBM must trade to hit the three profit targets:
Out of 16 total, the 15%, 22.5%, and 45% profit targets may only be hit on 10, 8, and 4 trading days, respectively. As profit target increases, fewer days are available to hit the target.
Next, study Columns D, F, and G, which compare the magnitude of price ranges over which profit targets will be hit. I made a Day 12 comparison with the red and yellow lines, above. Columns F and G indicate that on two out of the four days when the 45% profit target may possibly be hit (Days 18 and 19), the price range is 52% as wide or less than that required to hit the lower profit targets.
Not only do higher profit targets allow for fewer days when price targets may be hit, they also mean for a lower chance of hitting targets on those days.
My last post on negative gamma risk (http://www.optionfanatic.com/2012/04/27/undressing-negative-gamma-risk/) explains this. As option expiration approaches, routine changes in stock price can cost us more and more money–potentially even turning a nicely profitable trade into a loser at the last moment.
This is the argument against holding a modestly profitable trade longer in an attempt to hit the higher profit targets.
Tags: income trading | Categories: Money Management, Option Trading | Comments (0) | PermalinkSizing Risk (Part I)
Posted by Mark on April 26, 2012 at 10:08 | Last modified: April 26, 2012 10:08In my last post on profit factor (http://www.optionfanatic.com/2012/04/24/introduction-to-profit-factor/), I mentioned that one way to run a viable trading business it to keep the average loss somewhat equivalent to the average gain. Sizing risk is a sneaky impediment to consistent profitability that describes the potential for larger losses with more capital employed and also to the potential for smaller gains with less capital employed.
A typical positive theta option trading plan involves scaling with a 15% profit target and 20% max loss. The trade is initially placed with 1/3 total capital. As the market moves against the trade, another 1/3 of the total capital is deployed as an adjustment. If the market continues to move against the trade, the final 1/3 of capital is deployed.
In periods where the market moves sideways, the trade will hit its profit target with only one-third total capital utilized. In more challenging times, all capital will be deployed. When the 20% max loss is hit, it will be 20% of the full capital deployment. When the profit target is hit, it may be on 33%, 67%, or 100% of total capital allocation depending on whether any scaling was necessary. In effect, then, this trading plan has a max loss of 20% with a profit target of 10% (the average of 33% capital allocation * 15%, 67% capital allocation * 15%, and 100% capital allocation * 15%).
Before I go into why this results in a challenged trading strategy, I need to make a detour. The logical response would be to hold the trade until 15% profit is realized on total capital whether or not total capital is committed.
In my next post, I will begin to traverse this detour with a discussion of negative gamma risk.
Tags: income trading | Categories: Money Management, Option Trading | Comments (2) | PermalinkThe Naked Put (Part IV)
Posted by Mark on March 27, 2012 at 08:35 | Last modified: March 29, 2012 13:57In my last post on 3/25/12 (http://www.optionfanatic.com/2012/03/25/the-naked-put-part-iii/), I continued analysis of an AAPL 510 naked put income trade. I concluded the max risk on this trade to be $102,000 if overlapping trades both take assignment, but this is highly unlikely for a couple reasons.
First, AAPL stock would have to drop over 15% to reach $510/share. AAPL stock has not dropped this precipitously in years. This is over 90 points, which would be nine times the daily average true range of the stock over the past 15 days.
Second, the conditions by which assignment is most favorable are not present at this time. Assignment most commonly occurs just before a dividend is issued or near option expiration when virtually all time value has decayed from an option (hold that thought for a later blog post). With 33 days to option expiration, in order for our 510 put to be at risk for assignment and lose most of its time premium, AAPL stock would have to fall at least 30%.
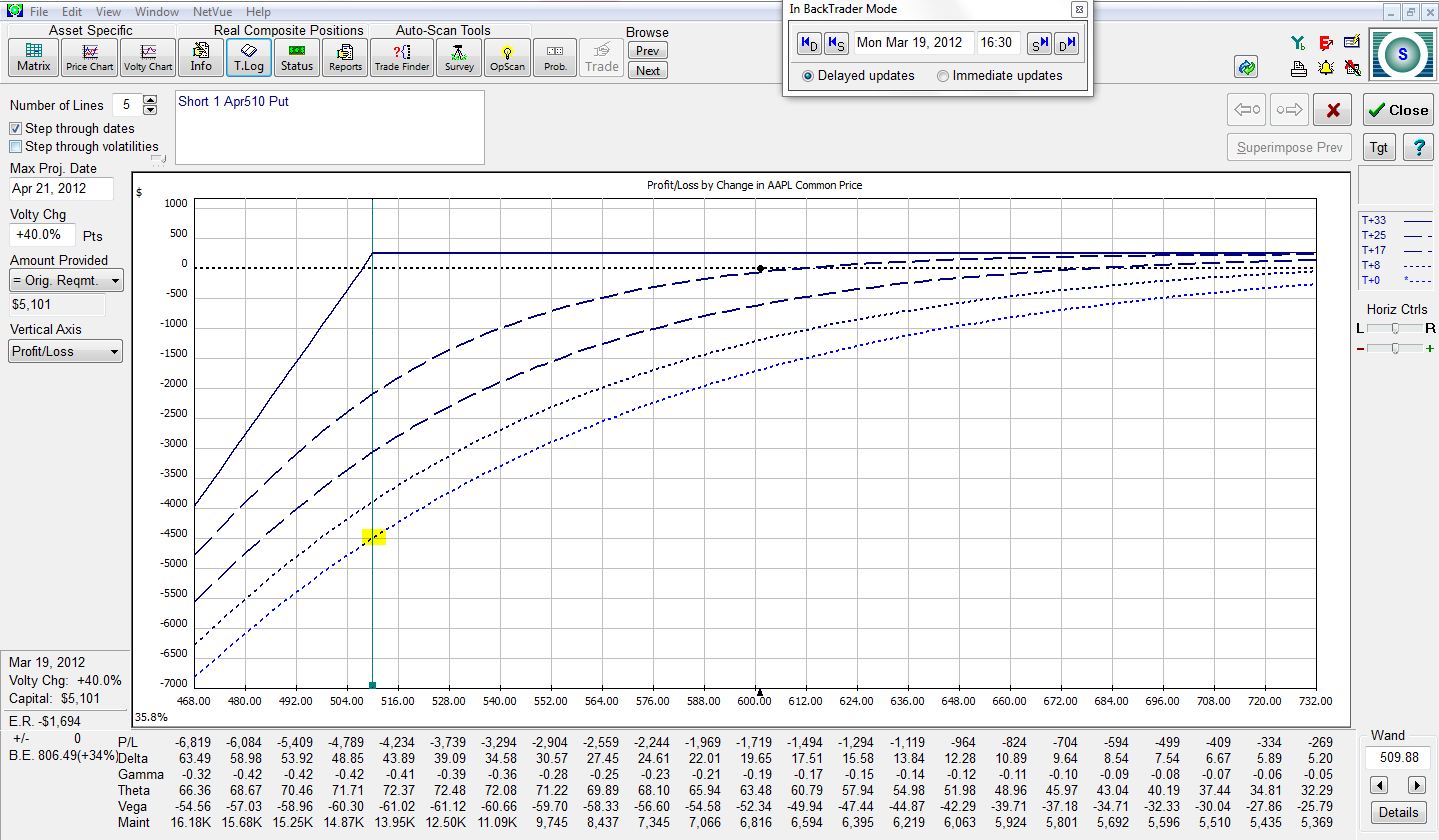
Suppose AAPL stock fell to the strike price of $510 on Trade Day #1. The risk graph would look like this:
The trade is now down $4,500. That’s much less than the max risk we calculated of $51,000 for one trade. The more time it takes for AAPL to fall to 510, the less this loss would be. This is diagrammed by moving step-by-step up the series of dotted lines.
In order to lose more than $4,500 on this trade, AAPL would have to fall below $510. The longer we are in the trade, the farther below $510 AAPL would have to fall. I’ll fudge this a bit to account for slippage and say the max loss would be $6,000 rather than $4,500.
For all practical purposes, then, if we enter a contingent order to exit this trade when AAPL hits $510, the max risk would be $6,000. Even if we had overlapping positions, this total is $12,000. The monthly return on this trade is now $240 / $12,000 = 2%. The annual return could be 24%.
The question to always ask is, “would there ever be a case where I would need more than $12,000 to hold this position?” I believe the answer to this question is yes. I will continue with the analysis in future posts.
Tags: income trading, risk management, trader education | Categories: Option Trading | Comments (0) | PermalinkThe Naked Put (Part III)
Posted by Mark on March 25, 2012 at 12:12 | Last modified: March 29, 2012 13:56Option income trading purports to generate consistent profits on a daily basis. As defined in my post on March 20 (http://www.optionfanatic.com/2012/03/20/the-naked-put-part-i/), an option income trade is a positive theta position. The exemplar I have been studying is an April 510 naked put on AAPL (see http://www.optionfanatic.com/2012/03/22/the-naked-put-part-ii/). The profit potential for this trade is $240/contract.
To better understand this trade, we need to know the risk. If AAPL sinks below $510 then the naked put could be assigned. The max risk of this trade is therefore $510/share * 100 shares = $51,000. While your stock would most probably have significant market value, in the worst-case scenario with AAPL stock crashing to zero, you would be out $51,000. The max potential return on this trade is therefore $240 / $51,000 = 0.47%.
Repeating this sort of trade every month would roughly generate an annualized return of 0.47% * 12 = 5.6%, right? Not exactly. With the trade being placed with 33 days to expiration, the possibility is great for two overlapping positions to be on at once. The max risk therefore has to be 2 * $51,000 or $102,000. This now yields a max annualized return of 2.8%.
While 2.8% is a very small return, realize how conservative this trade is. AAPL would have to fall 15% within 33 days in order for the profit not to be made on this trade. If you look back on a price chart, you’ll find it has been years since AAPL has fallen 15% in 33 days. Anything is possible, but because this would be such a rarity, many market observers would consider this trade to be reliable like an ATM machine.
Is this an accurate portrayal? I’ll cover some further insights in my next post.
Tags: critical thinking, income trading, trader education | Categories: Option Trading | Comments (3) | PermalinkThe Naked Put (Part II)
Posted by Mark on March 22, 2012 at 10:53 | Last modified: March 29, 2012 13:56The holy grail of trading could be achieved through booking consistent profit on a daily basis. In my last post on March 20 (http://www.optionfanatic.com/2012/03/20/the-naked-put-part-i/), I described an April 510 naked put trade on AAPL. Today, I want to illustrate that trade by presenting a series of risk graphs.
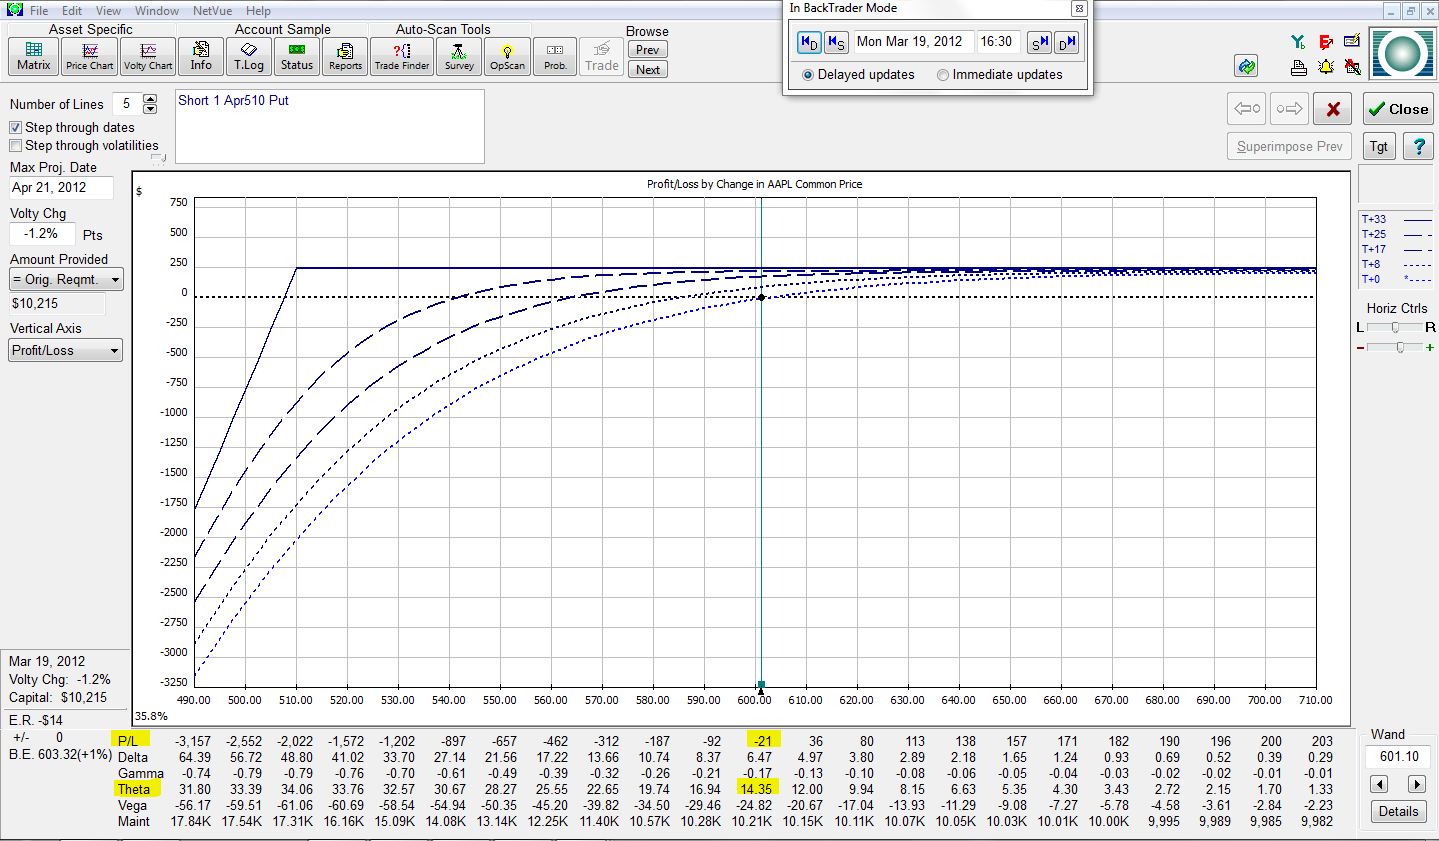
As mentioned, the trade was placed on March 19, with 33 days to April options expiration. At trade inception, the trade looks like this:
The green vertical line is the “wand,” which now sits at AAPL’s current price of 601.10. For the purposes of this analysis, I will assume stock price and volatility (to be described at a later date) always remain constant. The risk graph shows the P/L of the position (y-axis) based on the price of AAPL stock (x-axis). At trade inception, focus on the T+0 curve, which is the lowest dotted curve (also differentiated by a lighter blue color). The yellow highlighting indicates the trade to be currently losing $21 due to transaction costs and to have a theta value of 14.35. The trade will make $14.35/day.
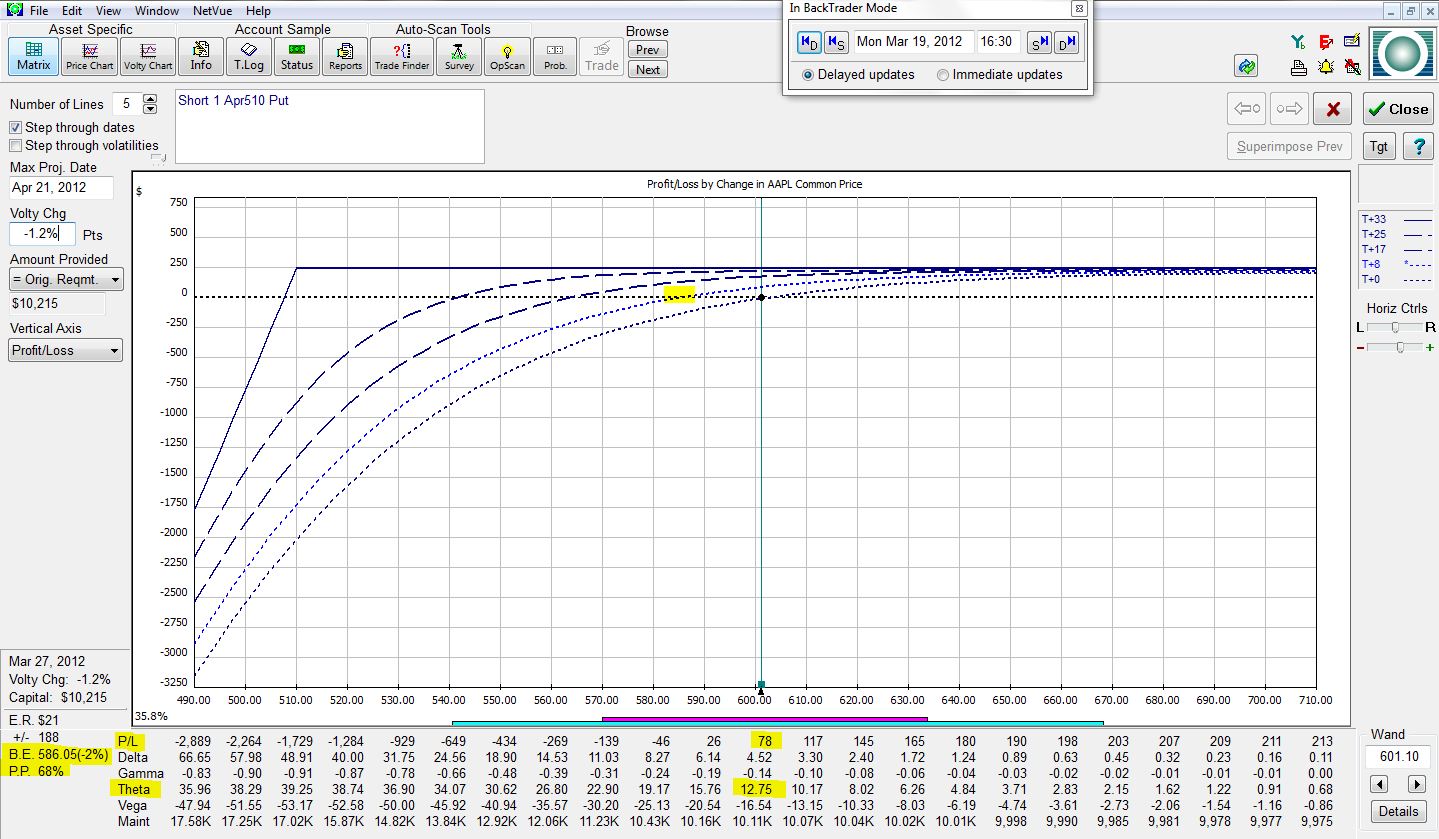
Let’s now fast forward to the next-higher dotted curve, which represents the position eight days into the future:
The P/L is +$78 with a theta value of 12.75. The trade will now make $12.75 per day. The yellow highlighted portion on the dotted curve corresponds with the “B.E.” in the lower left of the risk graph. This shows how far the stock would have to fall (2%) for the trade to be at breakeven (P/L = $0). P.P. is “probability of profit.” Eight days into the future, the risk graph shows this trade to have a 68% chance of being profitable.
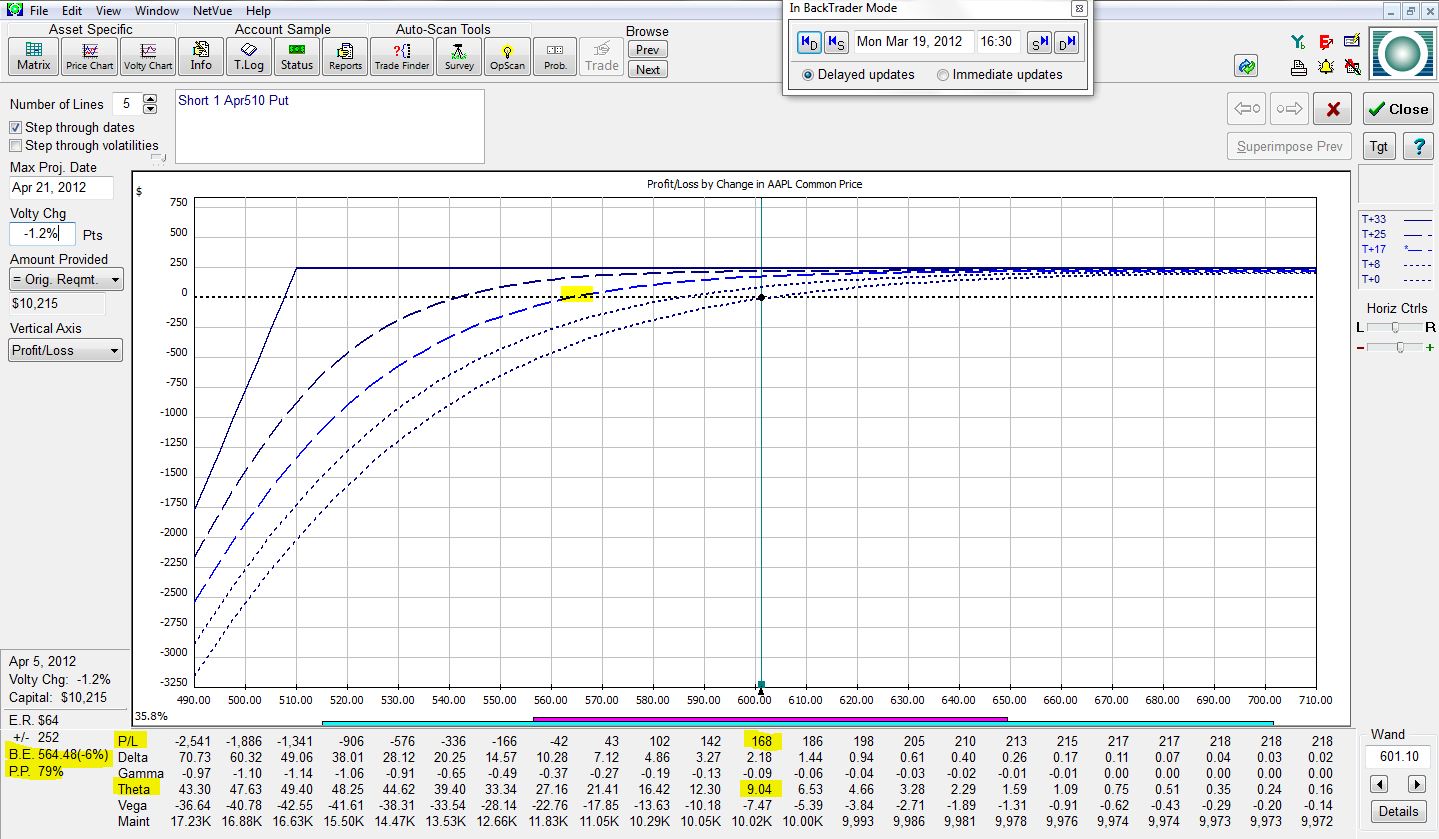
Next, let’s jump nine more days into the future:
The P/L is now +$168 with a theta value of 9.04. The B.E. is 6% below the current market price, which means AAPL stock could drop up to 6% before the profit on this trade evaporates. The trade would have a 79% chance of showing a profit.
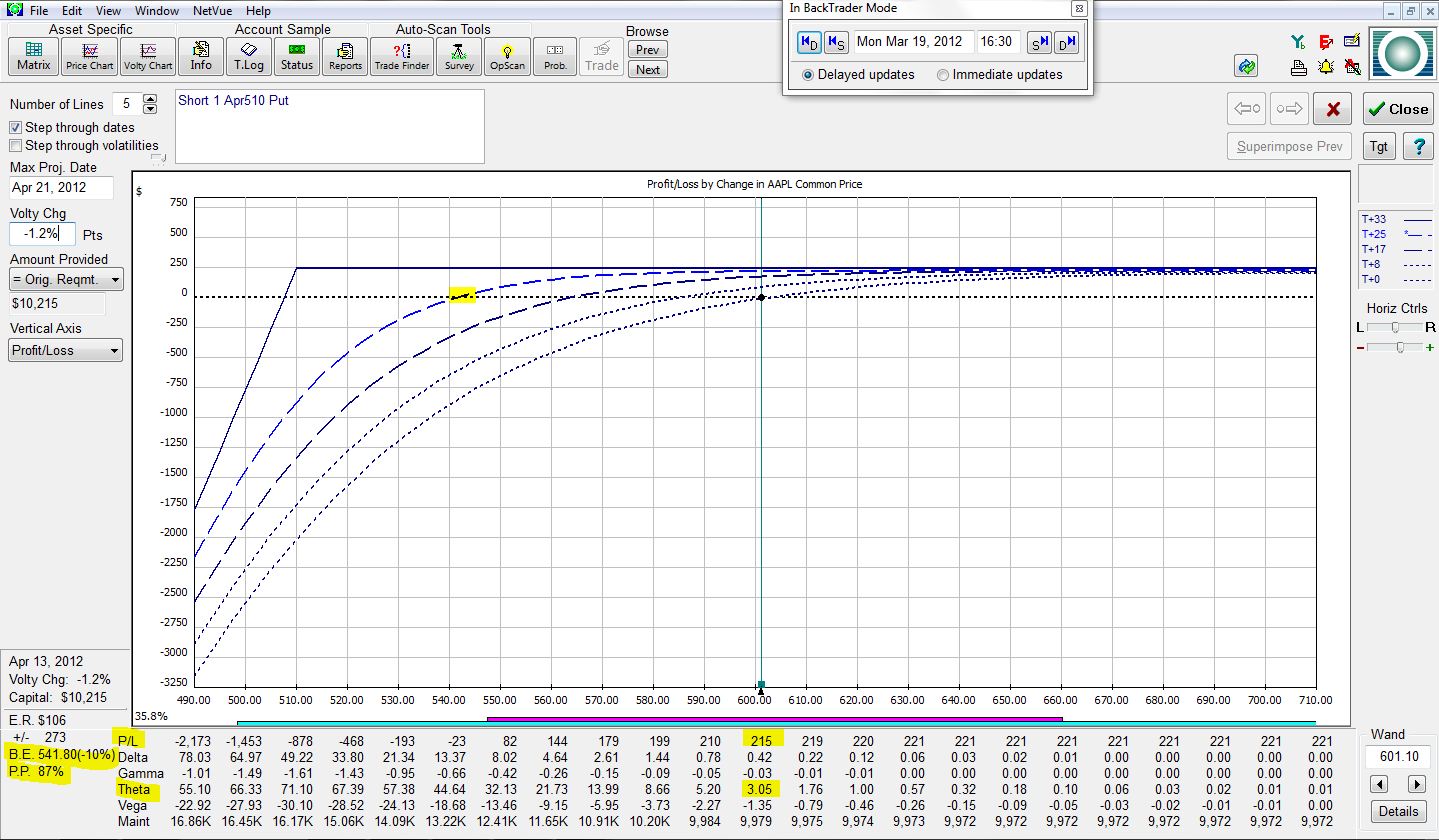
Moving eight days further ahead:
The trade is now up $215 with a theta value of 3.05. AAPL stock could fall up to 10% without this trade showing a loss. The probability of this trade being profitable after 25 days is 87%.
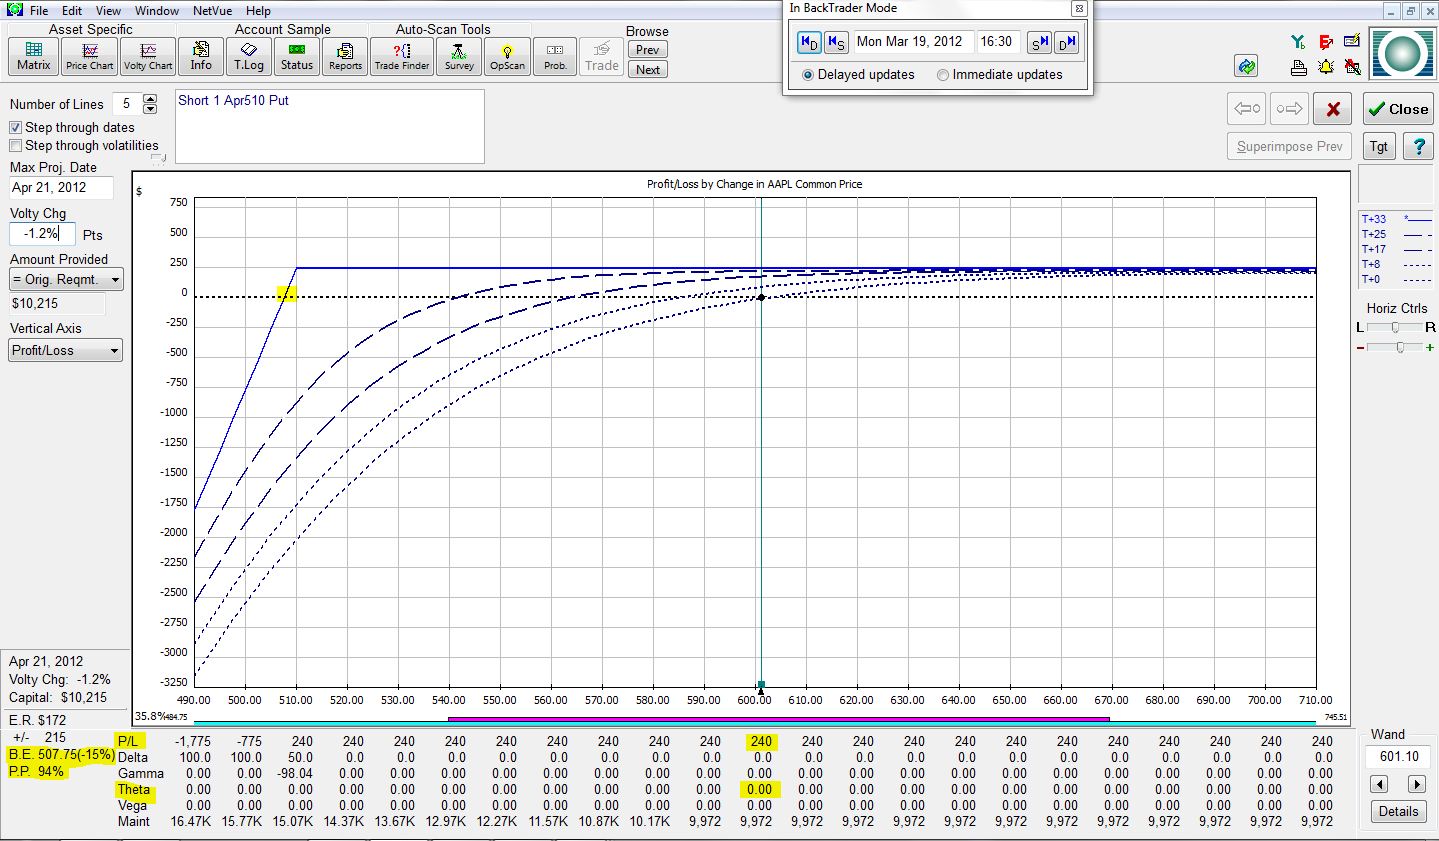
Finally, the risk graph at expiration (eight more days into the future or 33 total days from trade inception) is:
The trade has made the full $240. Theta is now zero since the option has expired. The trade has 15% of downside stock protection and a 94% chance of posting a profit.
Note how theta decreases over time as more and more of the available profit has been made on the trade. In my next post, I will discuss some implications of this observation and go into more detail about the trade.
Tags: income trading, trader education | Categories: Option Trading | Comments (2) | PermalinkThe Naked Put (Part I)
Posted by Mark on March 20, 2012 at 08:08 | Last modified: March 28, 2012 07:43In the quest for consistent trading profits, I have turned to option income trading: the establishment of a positive theta position. Theta is an “option greek” that describes what will happen to your P/L as each day passes. When you establish a positive theta position, you can expect to make daily money from time decay.
In theory, this is best understood by assuming no change in stock price from now until expiration. On March 19, AAPL stock closed at $601.10. I can sell an April 510 put for about $2.40. If AAPL remains at $601 then with the passage of each day, I stand to make about $14. When the option expires worthless in 33 days, the entire $240 will be mine.
Of course, no free lunch exists with option trading [or anything else?]. In exchange for the $14/day, I have taken on the obligation to buy 100 shares of AAPL for $510/share (the “strike price”) on or before April 21. As long as AAPL remains above the strike price, nobody in their right mind would have me buy their shares for $510 each because they could sell on the open market for a higher price. This is why the 510 put would expire worthless.
As with all aspects of trading and investing, option income trading is paired with risk. In future posts, I’ll talk more about this risk, volatility, and different aspects of option trading that I am fanatical about.
Tags: income trading, trader education | Categories: Option Trading | Comments (4) | Permalink