End-Of-Day Versus Intraday Trading (Part 1)
Posted by Mark on July 18, 2017 at 06:57 | Last modified: March 6, 2017 08:13One thing that came to mind from my recent blog series on backtesting frustration was the distinction between end-of-day (EOD) and intraday trading.
The most important aspect of EOD trading for me is once daily. This is much different from intraday trading where I could be watching the market continuously. For the sake of this discussion I will assume EOD takes place at the close but I really feel the exact time is arbitrary as long as it is consistent (e.g. 10:30 AM, 3:35 PM, etc.).
EOD trading has pluses and minuses. Checking in on the market once daily is a plus. This makes for a very flexible work schedule. Another plus is the opportunity to realize windfall profits in excess of my target. On the other hand, I believe the biggest minus is the potential to realize windfall losses. If the loss at trading time is beyond my stop then I must take it no matter how bad it is.
One advantage of intraday trading is a greater opportunity to exit trades at a price target. This is because the probability of touching a certain profit level exceeds the probability of closing at that level. Suppose I am up 8% on a long stock trade with a 10% profit target. A small amount of market volatility the next day will likely push the trade to +10%. To close at +10%, though, the market has to have an up day. In this case I would not be able to capitalize on so many of the choppy days where the market is higher intraday before closing lower.
Another advantage to intraday trading is the opportunity to realize tighter stops. Suppose my trade with a 15% stop-loss closed down 14% yesterday. As an EOD trader, should the downtrend continue today then who knows how far beyond -15% the trade might be when I have to exit at the close? Were I trading intraday, I could likely exit much closer to that -15%.
This is also a disadvantage to intraday trading, however. I may sometimes get stopped out for a loss on trades that briefly fall below my stop only to see them reverse higher as they ride off into the sunset without me, never looking back.
EOD or intraday? This is a tough, tough deliberation.
I will continue next time.
Categories: Financial Literacy | Comments (1) | PermalinkBacktesting Frustration (Part 6)
Posted by Mark on July 13, 2017 at 05:46 | Last modified: March 5, 2017 09:10This has been a very beneficial exercise in expository writing because at the outset I was not sure I would ever get through. One question remains: why bother backtesting 2001 – 2003 if this part of the database has so many holes?
2001 – 2003 presents a critical sampling of different market environments. The 9/11 crash is followed by a sharp bullish reversal into January 2002. From April 2002 to July 2002 the market fell 29% before falling 20% from August 2002 to October 2002. The market then rallied 63% from March 2003 through December 2003. These may be the only occurrences in the database of such wide-ranging action at low market prices. And even if they weren’t the only occurrences, the total number of occurrences is small enough to make each one critically important.
I feel better having gotten all of this frustration out in writing.
With regard to the abandoned butterfly backtest, I think I will simply the column headers and take it a smaller chunk at a time. As mentioned earlier, I am trying to accept that my backtesting will take much longer than it probably should. This will be one of those cases but at least it will get done and hopefully from it I will get some very insightful analysis.
Categories: Backtesting | Comments (0) | PermalinkBacktesting Frustration (Part 5)
Posted by Mark on July 10, 2017 at 07:10 | Last modified: March 5, 2017 08:40Given everything I said about spotty/flawed data, and the occasional need to manually add additional strike prices, starting later would probably be better. This presents another set of backtesting problems that I will discuss today.
Starting the backtest where I know the database is more complete (e.g. 2005) would result in fewer workarounds, fewer holdups, and faster overall progress. By shifting the hardest work to the end, this would serve as an effective antidote for much of the frustration I have been discussing in this blog mini-series.
Unfortunately, in order to generate an equity curve I need to start at the beginning. The process records account value every trading day to allow any errors to be immediately identified and fixed, which preserves integrity of the curve. Also as a cumulative summation to date, an equity curve does not even make sense without all previous trades being logged.
In order to get through, I have just been trying to accept that the research will take much longer than it probably should. I go through the 16-year database once to perform the backtrades. I then go through the database again to record equity values. I can’t do it all together when my attention is split in so many different directions trying to keep up with what statistics to record (dictated by the column headers), filling in missing data, and sometimes reviewing for data accuracy. The harsh reality is that a second time through can easily add 2-4 weeks on top of what has already been 2-4 months.
Backtesting stop-losses presents a similar conundrum. This is what inspired the current blog series after frustration forced me to abandon my last butterfly backtest. I tried to include stops in the column headers so I could watch for them every trading day. I was monitoring two profit targets, two stop-loss levels, and MAEs for multiple open trades in a spotty portion of the database. My cognitive capability was simply overwhelmed.
One could argue the most accurate way to collect stop-loss information is to first record MAE for all backtrades and then filter by different stop levels (e.g. 1x, 2x, 3x) to later go back and retest only those trades reaching the different levels to determine the actual end-of-day losses.
While it may be accurate, it certainly is not efficient or fast. I hope OptionVue can help me more with that as time goes by.
Categories: Backtesting | Comments (1) | PermalinkBacktesting Frustration (Part 4)
Posted by Mark on July 7, 2017 at 06:48 | Last modified: March 3, 2017 05:17Today I continue to hack my way through this difficult exercise of putting into words exactly why I sometimes find backtesting to be paralyzingly frustrating.
And yes, that really is a word:
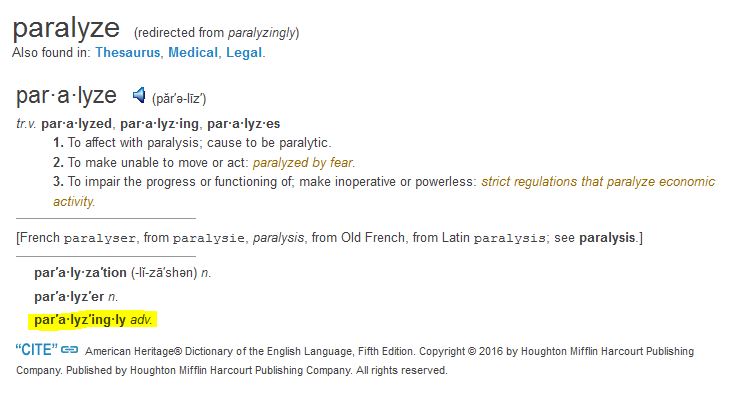
(sorry but some periodic comic relief along with that candy are what it’s taking to get me through a subject like this)
Flawed data decreases backtesting accuracy by an indeterminate amount. I do not realize the data is flawed so I don’t know how often errors occur, to what extent, and therefore how large the impact. The reason I don’t routinely screen for inconsistencies is because a backtest is usually thousands of trades that will already take months to complete. Scrutinizing every historical day would take much longer. Besides, I shouldn’t have to do this. I pay a lot for OptionVue (OV) because I trust they offer a valuable tool. If I cannot trust the data then what good is the software?
In addition to being occasionally flawed, the OV data is spotty at times (especially 2001 – 2003). Missing data must be filled in with theoretical prices (less accurate) but when theoreticals are not available I have to enter prices manually based on a logical vertical volatility skew. This adds 2-3 minutes per historical day.
I also have to deal with insufficient strike availability. Consider below with the underlying at $460:
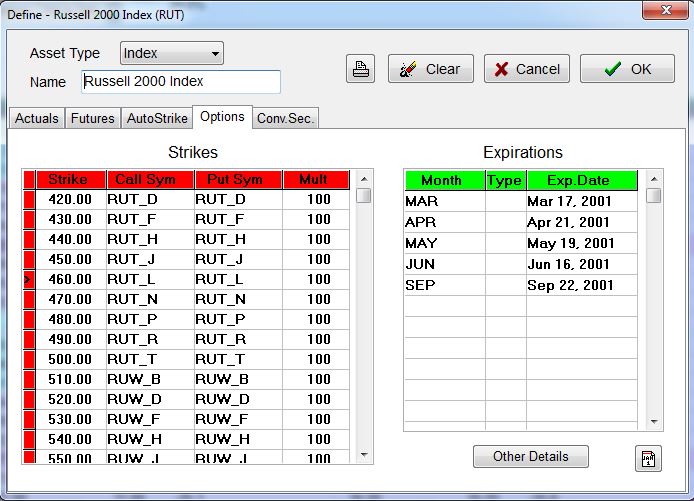
My backtest will require options down to 410 and sometimes 380. When I manually add these:
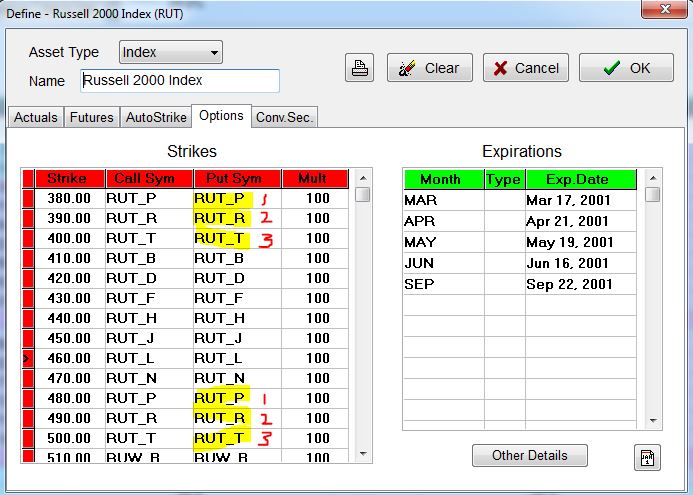
OV automatically duplicates root symbols (see red numbers), which results in flawed (duplicated) option prices:
So when forced to add strikes manually, I need to fill in with root symbols that I may not know. Sometimes I jump to a portion of the database I feel confident will have options in that range to determine the correct letters. For example, if I need strikes in the 300s then I can try jumping ahead to September 2001 where the underlying fell into the 300s to find out what letters were used. Once entered, I have to turn off the “Auto Strike” feature to prevent OV from resetting the matrix (automatically done on the first trading day of every week), which would thereby delete the additional work I have done—additional work that takes minutes, by the way.
And realize this problem is all secondary to the primary issue of an incomplete database.
I mentioned above that a backtest usually includes thousands of trades. You can imagine how tremendously frustrating it is to be repeatedly slowed down like this.
Categories: Backtesting | Comments (1) | PermalinkBacktesting Frustration (Part 3)
Posted by Mark on July 3, 2017 at 06:14 | Last modified: March 1, 2017 10:36Today I will continue discussing backtesting frustration specific to the OptionVue (OV) software.
My third issue is difficulty obtaining accurate margin requirements (MR). The Status window is an excellent piece of functionality that shows, at a glance, desired statistics for all open trades. Only sometimes do I get an accurate MR here, though. Technical support has told me that margin in OV pertains to short options. Debit trades, like the butterfly, do not necessarily have an associated MR. That does not explain why it intermittently works for me, though.
Rather than carving out certain types of positions on which to calculate margin, my preference would be a renaming to something like “buying power reduction” (BPR). All trades reduce buying power and if BPR exceeds the value of my account then I get a margin call: plain and simple. Knowing the BPR will allow me to calculate ROI, which I sometimes like to do.
Another suggestion is a more continuous tracking of MR throughout the course of the trade. At any given time, OptionNET Explorer—another software package in the options analytics space—displays two MRs: current cost and the maximum margin ever recorded. This would be useful to know because while trades have varying levels of margin, holding the maximum margin ever required on the sidelines offers a better chance of maintaining every trade to completion. I believe ROI should be calculated on maximum margin for the same reason. ROI will be diluted since most trades will not reach maximum MR but in live trading, it would be reckless to position size without having full reserve capital available for a worst-case scenario that will happen given a long enough investing horizon.
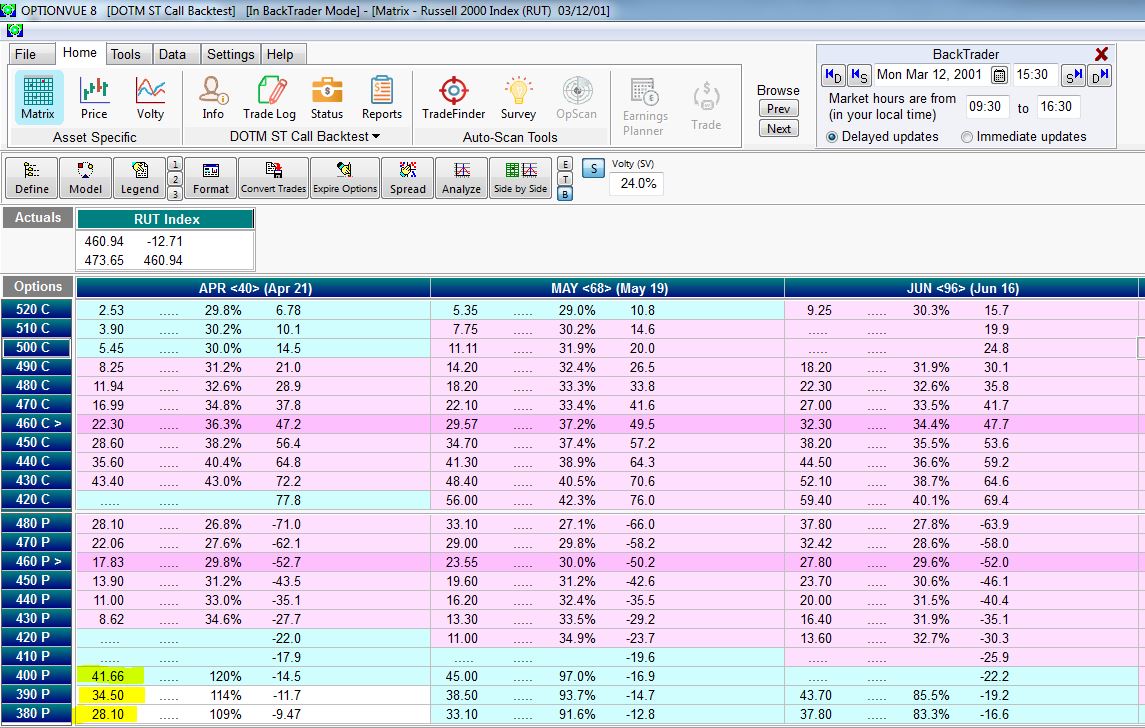
OV issue #4 is truly paralyzing for me at times: flawed and inconsistent price data. I have found the latter portion of the database to be pretty reliable. My concern is chiefly 2001 – 2004. Check out the following matrix screenshot:
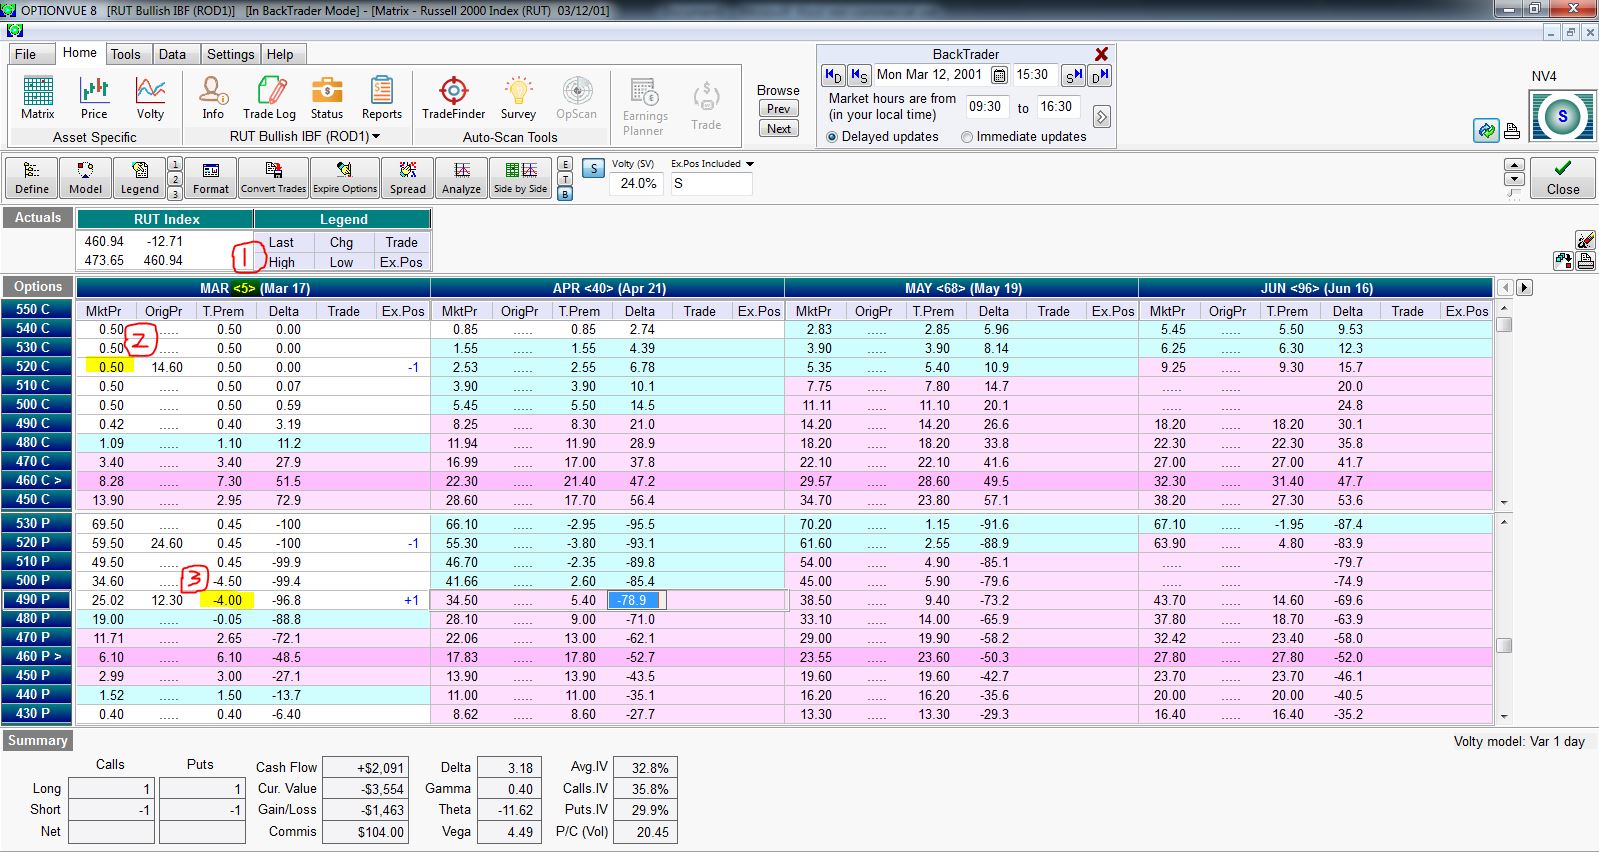
I have highlighted three problems in this matrix:
(1) has to do with the DTE calculation (five days shown for this expiration Monday), which I discussed last time.
(2) refers to the fact that the 500 – 540 calls are all priced at $0.50. This is bogus. Pouring salt on the wound is the fact that the 490 call is priced even lower. If this were ever true then the 490 would be bought and any/all of the 500 – 540 calls would be sold for a guaranteed profit until the price discrepancy went away.
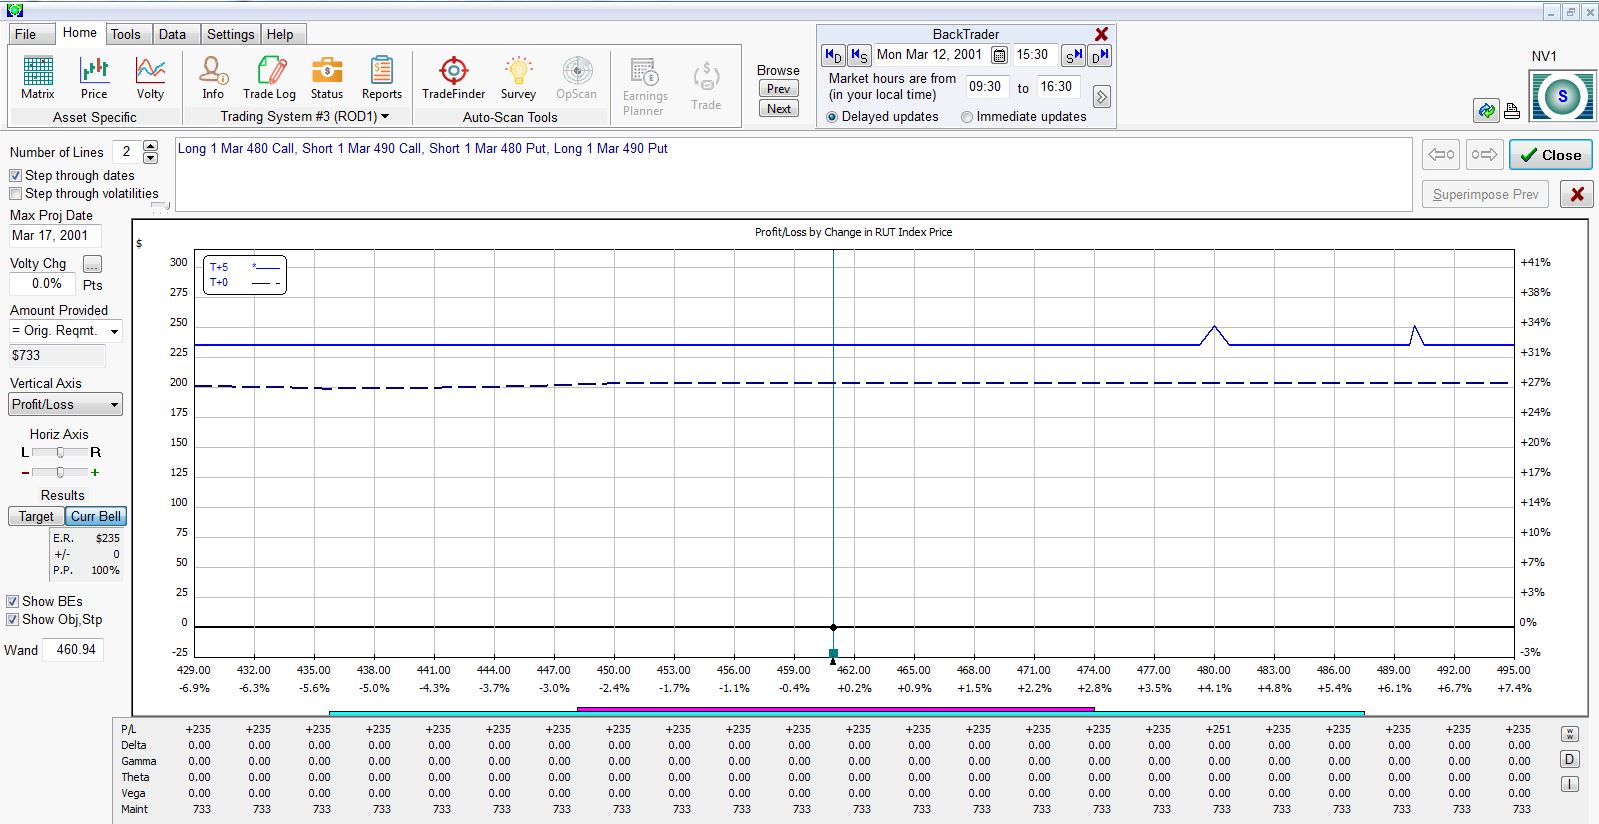
(3) shows the 490 put with -$4.00 of time premium. If that doesn’t make sense to you (it didn’t to me) then recognize the option is ~29 points in the money and priced ~$25. If this were ever true then I could trade a box spread (bull put and bear call vertical spreads at the same strikes) for a guaranteed profit:
As some guru used to say, if trading were that easy then it would be called winning.
I will continue next time.
Categories: Backtesting | Comments (0) | PermalinkBacktesting Frustration (Part 2)
Posted by Mark on June 29, 2017 at 07:12 | Last modified: March 1, 2017 10:03I left off talking about spreadsheet headers, which really define the whole backtesting project. Today I will continue by discussing some frustrating aspects of the OptionVue (OV) software itself.
Having opened for business in 1983, OV has more tenure in the “high-end options analytics” space than any other company. A more recent newcomer to the space is OptionNET Explorer. ThinkorSwim brokerage also has some backtesting functionality through its thinkBack module.
None of these software packages support automated backtesting. This would be a process by which I could define a trading system/guidelines and have the software automatically process the entire trading interval with an output of results in seconds (e.g. AmiBroker for stock/futures trading systems).
Since a delay is incurred to update the matrix (i.e. options chain) whenever I switch time or date, my approach is to enter a new backtrade on each trading day. To maximize efficiency, I try to monitor/record necessary statistics for each open trade while the data is loaded for that date. This includes PnL and anything else specified by the column headers.
Frustration #1 regards buggy R-codes (see last post), which has gotten worse over the last year’s worth of software updates. Positions displayed in the matrix are shown in the “Ex.Pos Included” field or checked in the pull-down menu:
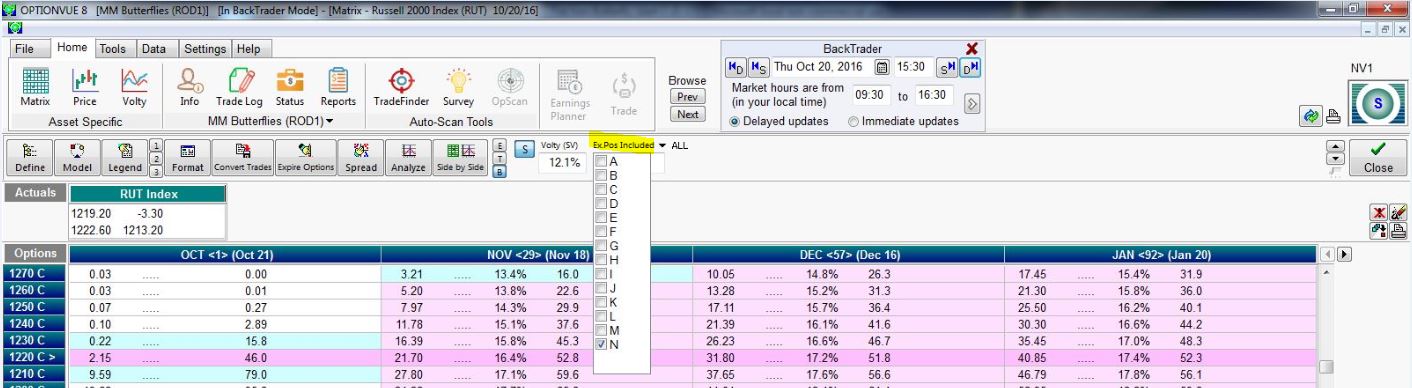
I used to be able to quickly scroll through open trades by typing the corresponding letter, number, or symbol into the Ex.Pos Included field (obstructed in this screenshot by the pull-down). I am now limited to letters and I often have difficulty entering them with keystrokes.
You can also see the “ALL” selection that toggles with “NONE” by clicking on the arrow. The “APPLY” button is only available intermittently and not in the current screenshot. If I try checking select positions, “ALL,” or “NONE” when the button is not available then I cannot move forward.
Issue #2 regards the days to expiration (DTE) calculation. When Backtrader is set to 2001 – 2002, DTE is calculated based on expiration Saturday. As far as I know, these options have always expired on Friday. The software is inconsistent as to when it changes DTE calculation from Saturday-based to Friday-based. When I tested this yesterday it was on 1/3/03. Today it happens on 1/13/03.
Either way, I have to remember whenever I visit the early portion of the database to check DTE in my head for consistency. Sometimes I will forget this for a few historical weeks/months and be forced to go back and modify every DTE number for affected trades. Cue additional frustration.
I will continue next time.
Categories: Backtesting | Comments (0) | PermalinkBacktesting Frustration (Part 1)
Posted by Mark on June 26, 2017 at 07:42 | Last modified: February 27, 2017 10:56On Saturday I started a backtest. I only got through 15 minutes before I quit in frustration. Today I want to explain why this happened and possibly flush out some insightful principles about the backtesting process as a result.
This is going to be a tough blog post to write. I just went for a dark chocolate mint 3 Musketeers bar. If I had candy corn here then I would have grabbed that. My best friends know what this means. Everyone else can probably guess.
I have brainstormed a good 1,200 words on this subject and full explanation of some of these concepts could be a lot lengthier. Some of these are lines of thinking having to do with statistics, trading system development, software, and intraday vs. end-of-day trading. If I can succeed in presenting the material in an organized fashion then at the very least it should be good fodder for discussion. At most it may serve as dynamic teaching material.
My first hassle when it comes to backtesting is how to label spreadsheet columns. What may seem like a simple detail really defines the whole thing. For the next few (to several) months I will be looking for and recording data defined by the column headers. If I get to the end and realize I forgot something critical then I may bang my head because I’ll be looking at months of additional work to go back and gather information rather than a few extra seconds per backtrade when I had the proper information on the screen.
My intent this past Saturday was to backtest a symmetric butterfly strategy. Here were the column headers I chose:

Font too small? Welcome to my world of squinting eyes. If I make it bigger then fewer columns fit on the screen at once and I have to use the scroll bar to enter routine data. Each second this adds gets multiplied by up to 4,000 backtrades, which also gets multiplied by two (back and forth).
Column (“Col”) A is date of trade inception. Col B is a letter code used to identify each day’s trade from all the trades currently in the transaction log. In OptionVue (the software I use) parlance this is called the R-code. Col C is the underlying price, Col D is the average implied volatility for all options in the chain, Col E is days to expiration (DTE), and Col F is the short strike for this position. Col G is the initial margin requirement for this position.
I have covered enough ground to explain some frustrations I have with the software itself. I will pick up here next time.
Categories: Backtesting | Comments (5) | PermalinkButterfly Backtesting Ideas (Part 1)
Posted by Mark on June 12, 2017 at 06:23 | Last modified: February 22, 2017 10:02I have completed one exhaustive butterfly backtest on dynamic iron butterflies (DIBF). While helpful for offering up some context, it left much to be desired.
Butterflies seem to be all the rage in trading communities these days so the main reason my backtest failed to impress is because the results were inconclusive. Slippage really made the difference between a trade that was profitable and one that was not. While tantalizing to think I can overcome slippage by simply entering a GTC limit order and waiting for a fill, unables do occur. Backtesting cannot fully determine the impact of unables primarily due to limited granularity of data (30-minute intervals).
I have some methodological issues that may have negatively impacted the results. The dynamic nature of the strategy means some trades were symmetric and others were asymmetric. An asymmetric butterfly will have a lower max loss potential to the upside. Even though most losses seem to have taken place on the downside, having a much larger upside loss potential (100%) hurts because the downside loss potential is the same either way (100%).
Aside from some trades being symmetric, those that were not had varying degrees of asymmetry. The greater the asymmetry, the lower potential loss to the upside in terms of ROI (%). Perhaps this should be standardized.
The need for standardization feeds directly into the next issue: use of percentages (ROI) instead of PnL. Because margin requirements ranged from $1,401 to $12,400, I used percentages to avoid having to normalize (e.g. two contracts of a $5,000 trade equates to one contract of a $10,000 trade). ROI is unaffected by margin requirements. Now consider a downside loss. Asymmetric and symmetric butterflies can both experience -100% ROIs when PnL is [much] worse for the asymmetric due to the embedded put credit spread. This doesn’t feel right.
One thing I could do with the DIBF backtest is normalize for margin requirement then recalculate the trade statistics based on PnL. This might serve as confirmation that I was on the right track with the initial analysis.
Categories: Backtesting | Comments (0) | PermalinkRolling Naked Puts (Part 2)
Posted by Mark on June 9, 2017 at 07:18 | Last modified: February 21, 2017 10:21Last time I presented some data in an attempt to replicate the Market Measures (MM) episode from November 8, 2016.
The backtesting methodologies are different. MM started with 0.30-delta naked puts. They took assignment at expiration and sold a 0.30-delta call against it. I started with 0.20-delta naked puts and whenever a 3x stop-loss was hit, I rolled out to the next available expiration month.
My reason for rejecting the roll adjustment had to do with the larger max drawdown (DD) and standard deviation (SD) of returns. MM did not present these statistics.
The Tasty Trade mantra “trade small and trade often” alleviates the DD/SD concern. This is an effective means to cover their *ss because no one loss would ever be catastrophic. I feel this works for people trading part-time as a hobby who have an independent paycheck consistently coming in.
I do not believe “trade small and trade often” works for people trading full-time as a business, however. Unless capitalized with millions of dollars, one cannot trade “small” and still be able to cover living expenses. When position sized as a viable business, most traders do not have enough diversified strategies to avoid widespread portfolio devastation should a naked put max DD type of event occur. This is why I believe max DD and SD of returns are necessary to design a workable trading plan.
My backtest included 509 trades that hit a 3x stop-loss but excluded an additional 376 trades that hit the 2x stop-loss level. Naked puts that lose on the roll are those where the market does not recover or continues to tank lower. These are the most severe losses and are included in the present backtest. Backtesting trades hitting the 2x stop-loss that do not go on to hit 3x would therefore probably improve overall results.
I do not believe inclusion of the 2x stop-loss trades would be enough to save the rolling strategy, however. While I would expect to see more than a 15% improvement, even if PnL improves by up to 50% (for example), the 4x larger max DD realized when rolling would necessitate a decrease in position size by 80% to equate the DD’s and 80% >> 50%.
Categories: Backtesting | Comments (0) | PermalinkRolling Naked Puts (Part 1)
Posted by Mark on June 6, 2017 at 06:48 | Last modified: February 20, 2017 09:42The motivation for this study comes from the Market Measures (MM) episode discussed here. Is rolling naked put losers a viable strategy for improving trade results?
Here are some important details from my study:
- All trading was done at 3:30 PM
- Used first strike with delta < 0.20
- Rolled put to next available expiration when 3x stop-loss hit
- Closed puts on expiration Thursday
- All trades subject to a $0.26/contract transaction fee
Here’s what I found:
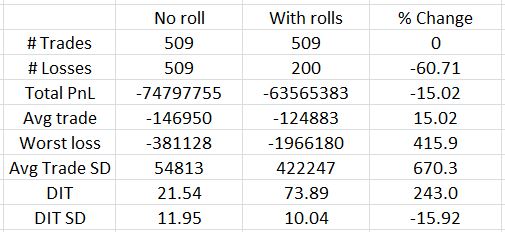
Out of 509 trades, only 200 lose on the roll. This represents a 60% reduction in number of losers as shown in the third column. Rolling reduces net loss by about 15% and the average trade improves on the roll by the same amount (rows 4-5). That is the good news.
Bad news starts with row 6: the worst loss increases by over 400% with rolling. The standard deviation (SD) of trade results also increases over 650%. I have discussed many times how maximum drawdown (DD) and SD both represent risk (e.g. here, here, and here). If I position size based on max DD then I would have to trade five times smaller with rolling than without. A 15% improvement in PnL is hardly going to compensate for that.
Days in trade (DIT) is obviously larger with the roll. It more than triples, though, and this will dilute the PnL improvement. Three non-rolling trades could be done in the roughly 74 days it would take for one rolling trade. With a win rate over 84%, odds are the sum of three trades will better the PnL of the rolled trade.
Looking back to the MM presentation, the biggest difference between my analysis and theirs is what they did not present. I have detailed this critique elsewhere. Like the MM episode, I looked at success rate, average PnL, and DIT. I also discussed max DD and SD of results, though, where MM did not. As it turns out, these are the statistics I find to be most decisive and they are the biggest reason I believe rolling is not viable. MM arrived at the opposite conclusion.
I don’t believe the full picture of rolling can be understood without analysis of max DD and PnL SD. Without them you may be headed for an awful surprise when max rolling DD is experienced with real money! That would not make for a pleasant day.
I will continue next time.
Categories: Backtesting | Comments (1) | Permalink