On Quantitative Trading
Posted by Mark on May 17, 2012 at 06:35 | Last modified: May 17, 2012 06:35“After the recent major losses at quantitative hedge funds, many people have started to wonder if quantitative trading is viable in the long term. Though the talk of the demise of quantitative strategies appears to be premature at this point, it is still an important question from the perspective of an independent trader. Once you have automated everything and your equity is growing exponentially, can you just sit back, relax, and enjoy your wealth? Unfortunately, experience tells us that strategies do lose their potency over time as more traders catch on to them. It takes ongoing research to supply you with new strategies.
There are always upheavals and major regime changes that may occur once every decade but will nevertheless cause sudden deaths to certain strategies. As with any commercial endeavor, a period of rapid growth will inevitably be followed by the steady if unspectacular returns of a mature business. As long as financial markets demand instant liquidity, however, there will always be a profitable niche for quantitative trading.”
–From Quantitative Trading (2009) by Ernest Chan
Categories: System Development, Wisdom | Comments (0) | PermalinkSizing Risk (Part III)
Posted by Mark on May 2, 2012 at 23:34 | Last modified: October 1, 2012 05:52Sizing Risk is a common trading plan element that can pose a challenge to consistent profitability.
As discussed in Part I (http://www.optionfanatic.com/2012/04/26/sizing-risk-part-i/), these are scaling trading plans with a profit target of 15% and max loss of 20%. Suppose $10,000 is allocated per tranche for up to three tranches. The trade will then profit $1,500, $3,000, or $4,500–fifteen percent–depending on how many tranches are placed. When the trade loses, it will usually be after completely scaling in: 20% of $30,000 is $6,000 lost.
This monthly trade will therefore have to profit at least 75% of the time to be profitable. If the trade wins eight months out of 12 and averages two tranches for each winning month then in one year it will make 8 months * $3,000/month = $24,000 and lose 4 months * $6,000/month = $24,000. If the trade only wins seven months and loses five months then the annual return will be -30%. Should it have a tough year and lose exactly as often as it wins, the annual return will be -60%, which is nothing less than a good recipe for grounding an account into hamburger meat.
As discussed in my posts on the naked put selling strategy (http://www.optionfanatic.com/2012/03/25/the-naked-put-part-iii/), a common worry amongst traders is to have one catastrophic loss that wipes out many profitable months. Sizing Risk teaches us that making too little in the winning months can be just as harmful to overall returns as catastrophic losses but is much more frequently overlooked.
Tags: income trading | Categories: Money Management, Option Trading | Comments (0) | PermalinkSizing Risk (Part II)
Posted by Mark on April 30, 2012 at 13:31 | Last modified: April 30, 2012 15:02In Part I on Sizing Risk (http://www.optionfanatic.com/2012/04/26/sizing-risk-part-i/), I described a scaling strategy that aims for a 15% profit target and 20% max loss. Because allocated capital may remain on the sidelines, the strategy actually aims for a 10% average profit target with 20% max loss. This lowered profit target raises a challenge to profit factor because it loses even more in bad months than it profits in good months.
If the trade reaches 15% profit on 33% or 67% of allocated capital then why not hold the trade until it reaches 45% or 22.5% profit respectively, which would be the same net profit as 15% on 100% of allocated capital?
On certain days, a profit target may be hit when IBM trades within a price range. For example, to hit the 22.5% profit target on trade day 12:
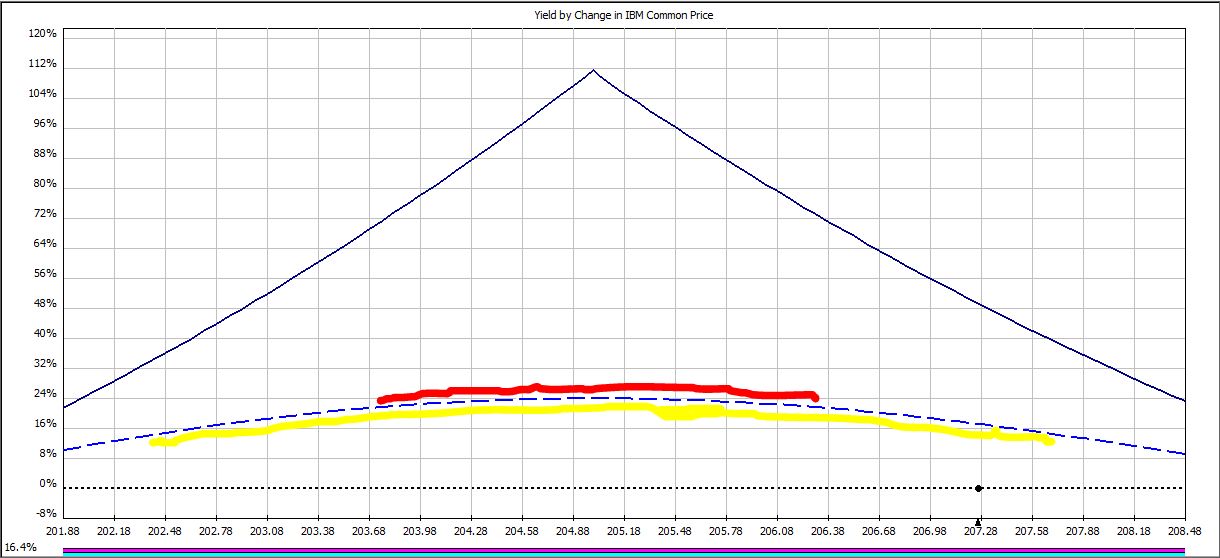
IBM must trade within a range only 22% as wide (red line) as it must trade to hit the 15% profit target (yellow line).
In the table below, Columns B, C, and E describe the range of price ($) in which IBM must trade to hit the three profit targets:
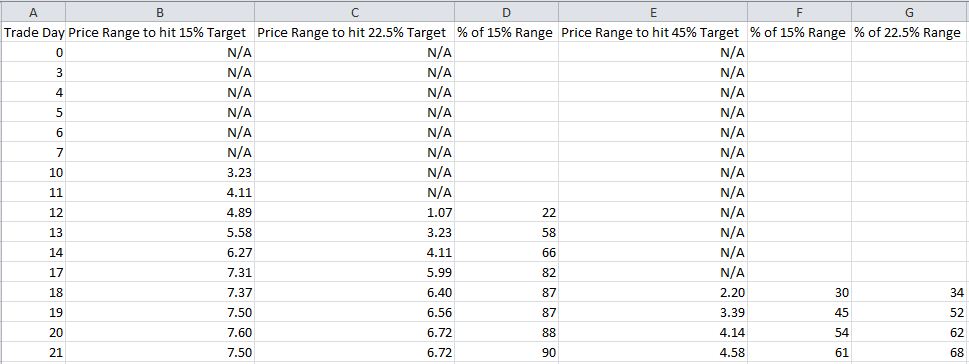
Out of 16 total, the 15%, 22.5%, and 45% profit targets may only be hit on 10, 8, and 4 trading days, respectively. As profit target increases, fewer days are available to hit the target.
Next, study Columns D, F, and G, which compare the magnitude of price ranges over which profit targets will be hit. I made a Day 12 comparison with the red and yellow lines, above. Columns F and G indicate that on two out of the four days when the 45% profit target may possibly be hit (Days 18 and 19), the price range is 52% as wide or less than that required to hit the lower profit targets.
Not only do higher profit targets allow for fewer days when price targets may be hit, they also mean for a lower chance of hitting targets on those days.
My last post on negative gamma risk (http://www.optionfanatic.com/2012/04/27/undressing-negative-gamma-risk/) explains this. As option expiration approaches, routine changes in stock price can cost us more and more money–potentially even turning a nicely profitable trade into a loser at the last moment.
This is the argument against holding a modestly profitable trade longer in an attempt to hit the higher profit targets.
Tags: income trading | Categories: Money Management, Option Trading | Comments (0) | PermalinkUndressing Negative Gamma Risk
Posted by Mark on April 27, 2012 at 13:42 | Last modified: April 27, 2012 13:46It’s rumored that fear and greed are the two emotions that drive markets. As an options trader I would argue that psychic pain, otherwise known as negative gamma risk, should be listed as the third.
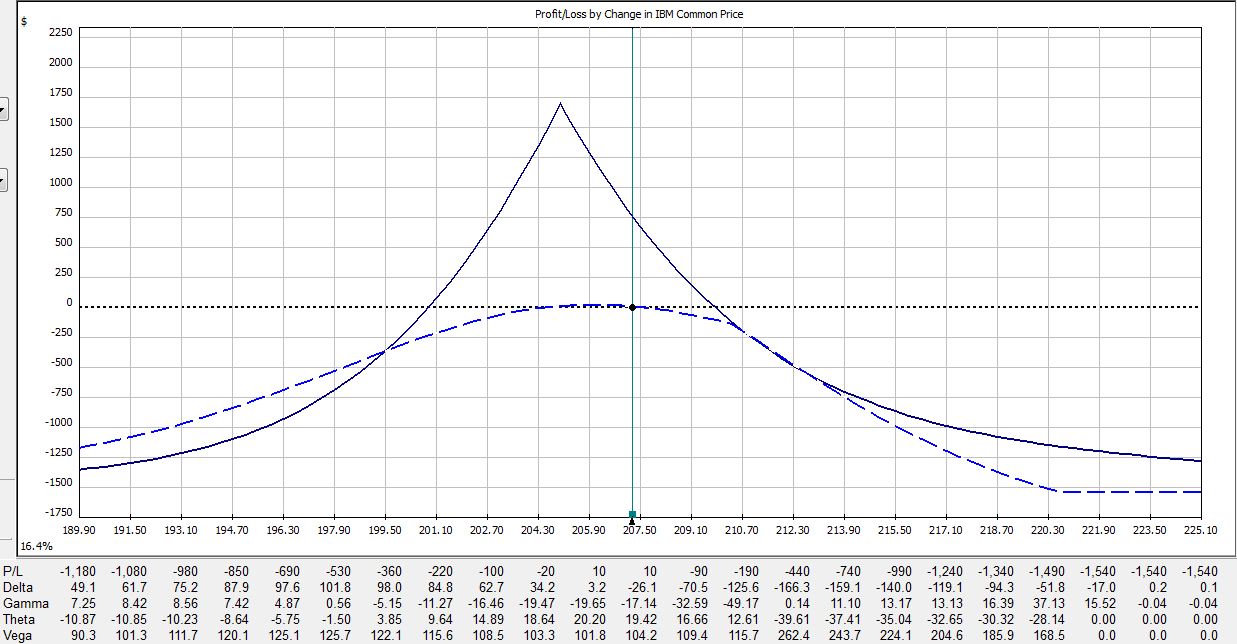
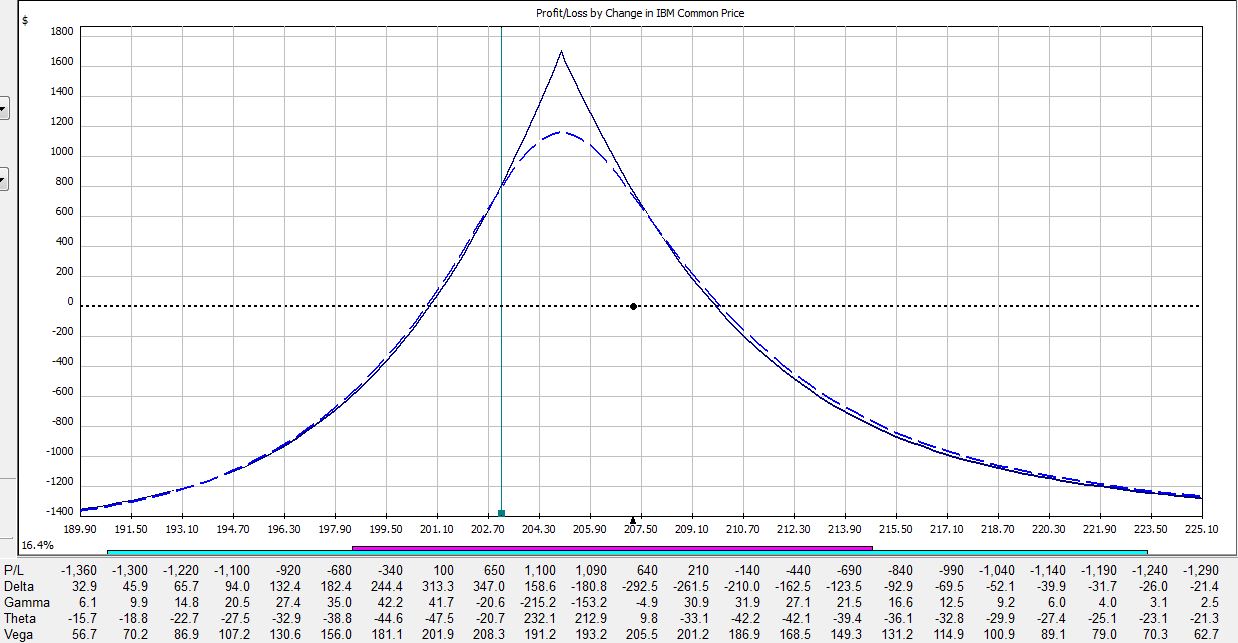
All pictures are risk graphs of a May/Jun 205 IBM call calendar trade (10 contracts) placed today (4/27/12), which is 22 days to May expiration. The P/L is the intersection of the green, vertical line and the blue dotted line.
At trade inception, we have this:
If IBM were to move up 2% today then the trade would be down $309:
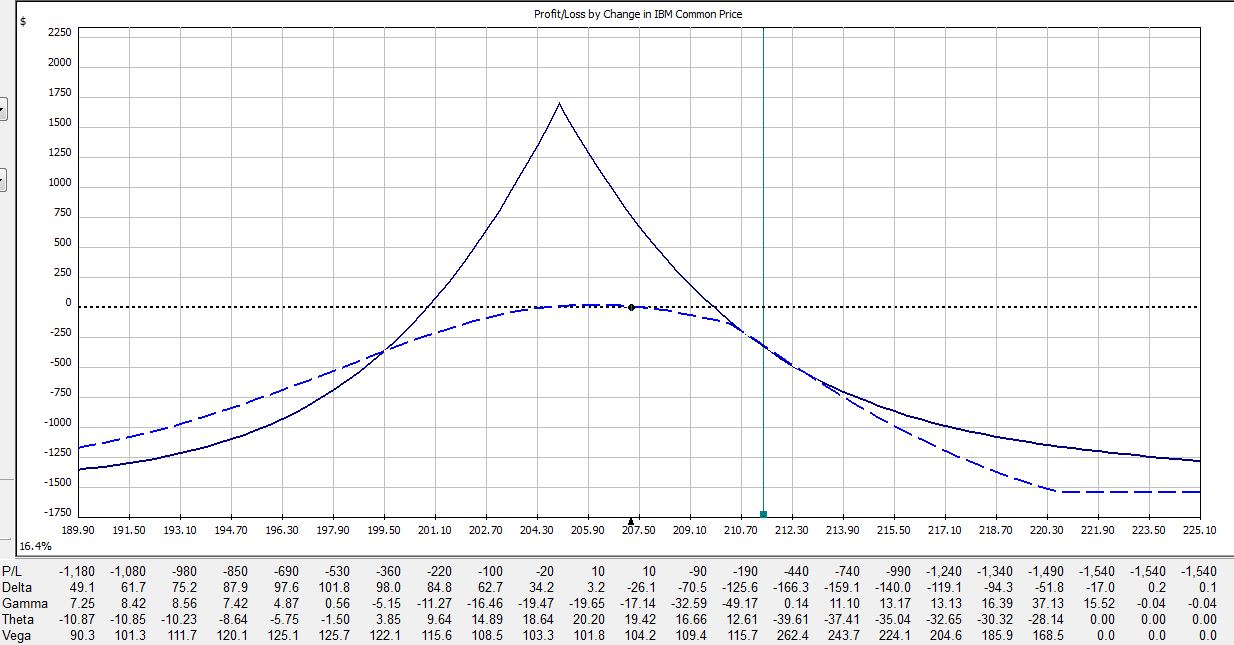
If IBM were to move down 2% today then the trade would be down $50:
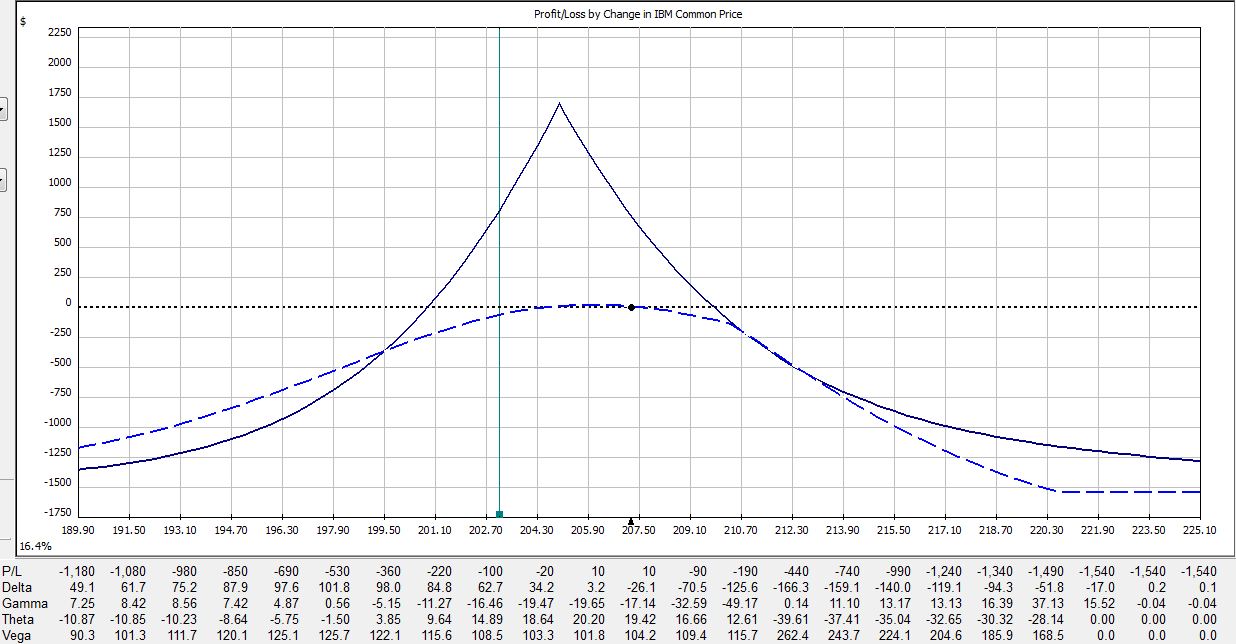
If IBM were to remain unchanged then in 15 days the trade would be up $353:
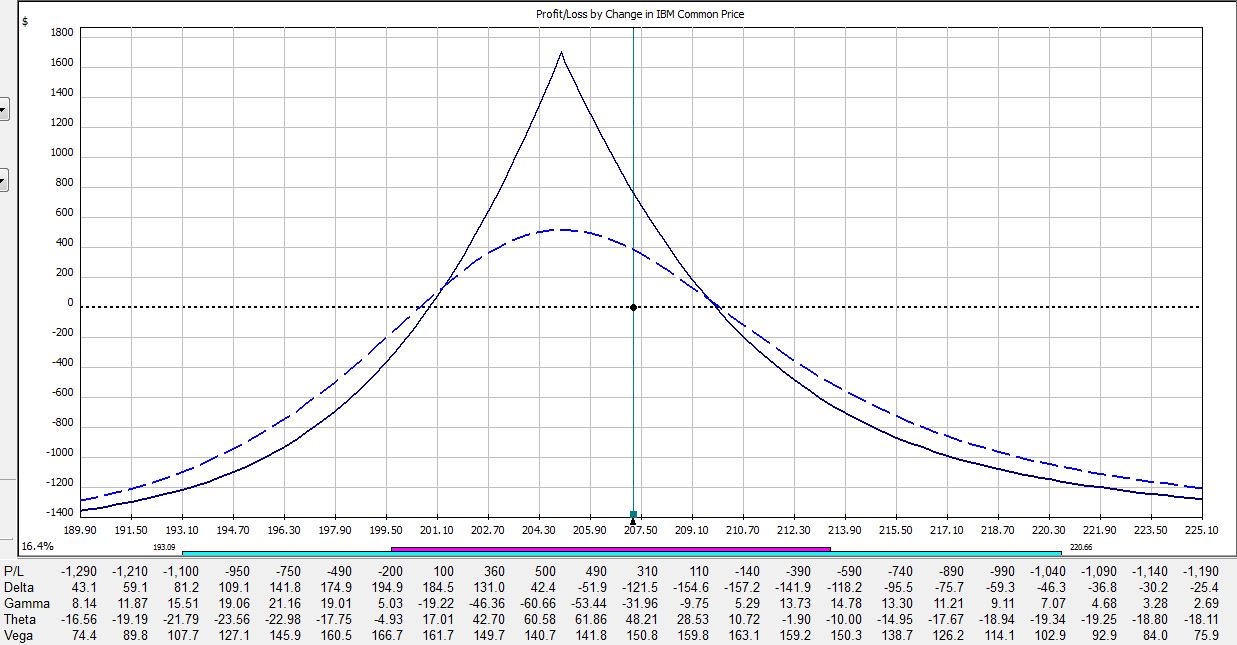
If IBM were to move up 2% then in 15 days the trade would be down $225:
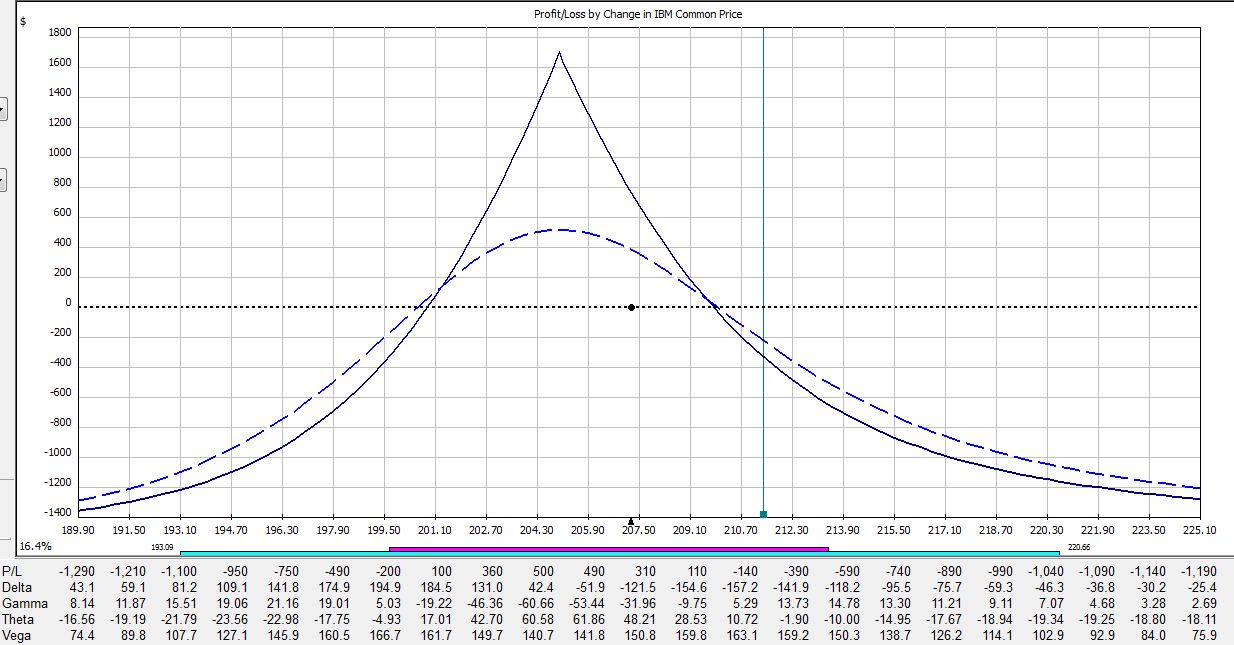
If IBM were to move down 2% then in 15 days the trade would be up $400:
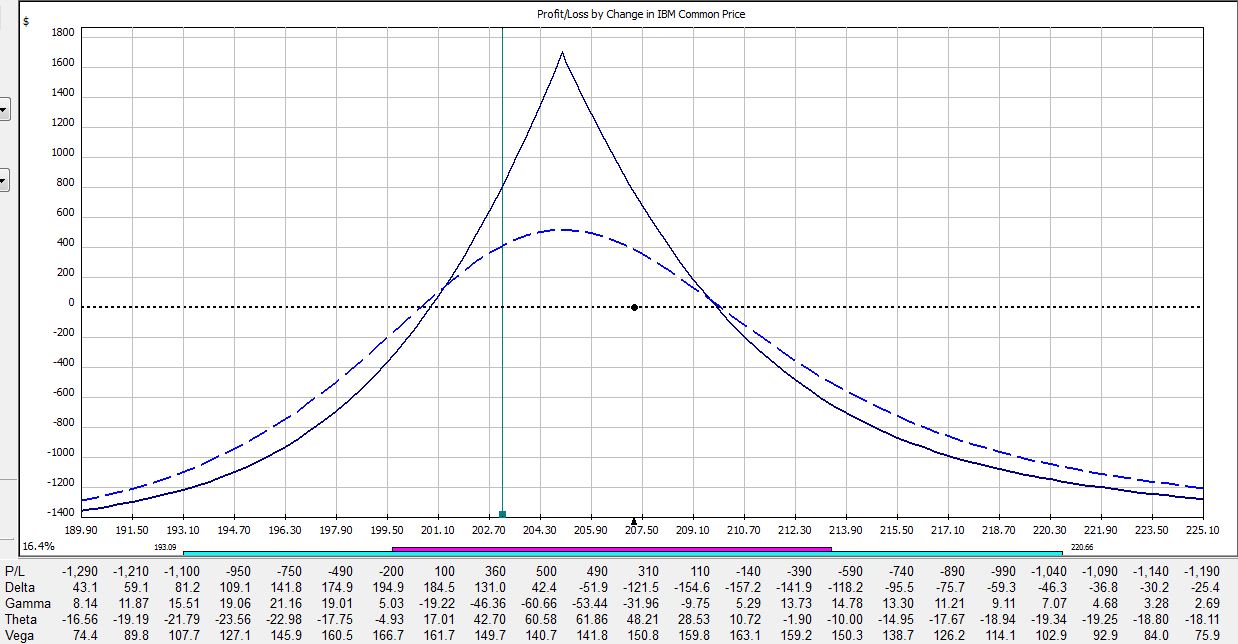
If IBM were to remain unchanged then in 21 days on the Friday before option expiration, the trade would be up $720:
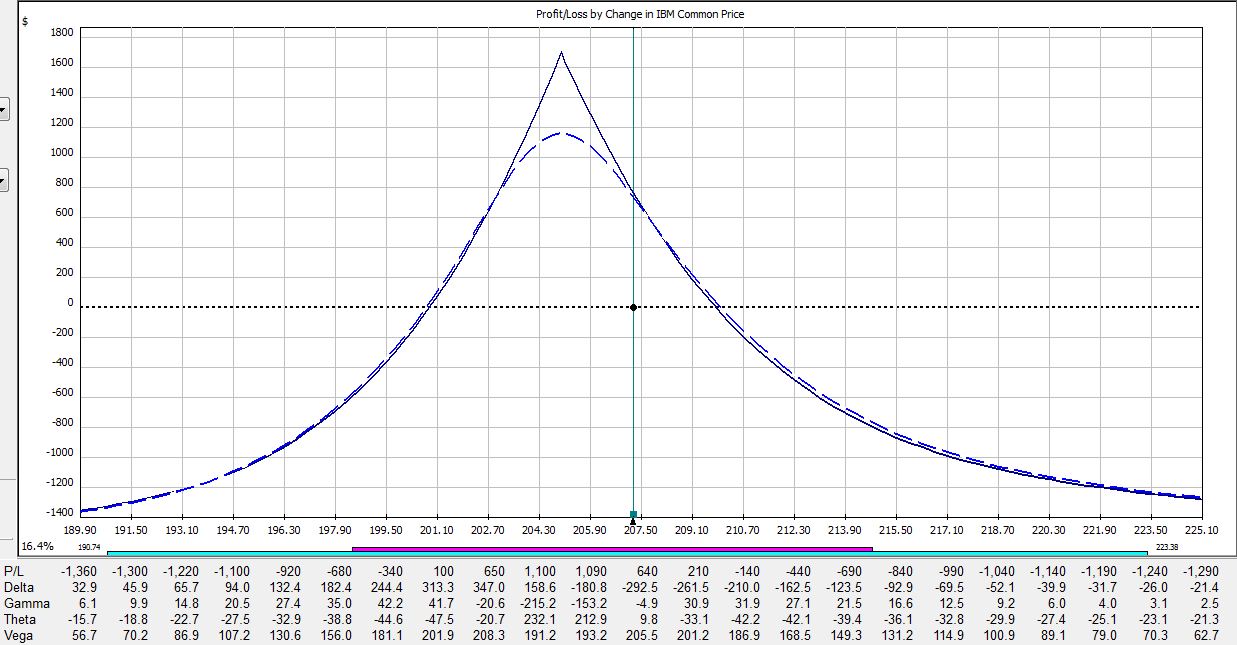
If IBM were to move up 2% then in 21 days the trade would be down $275:
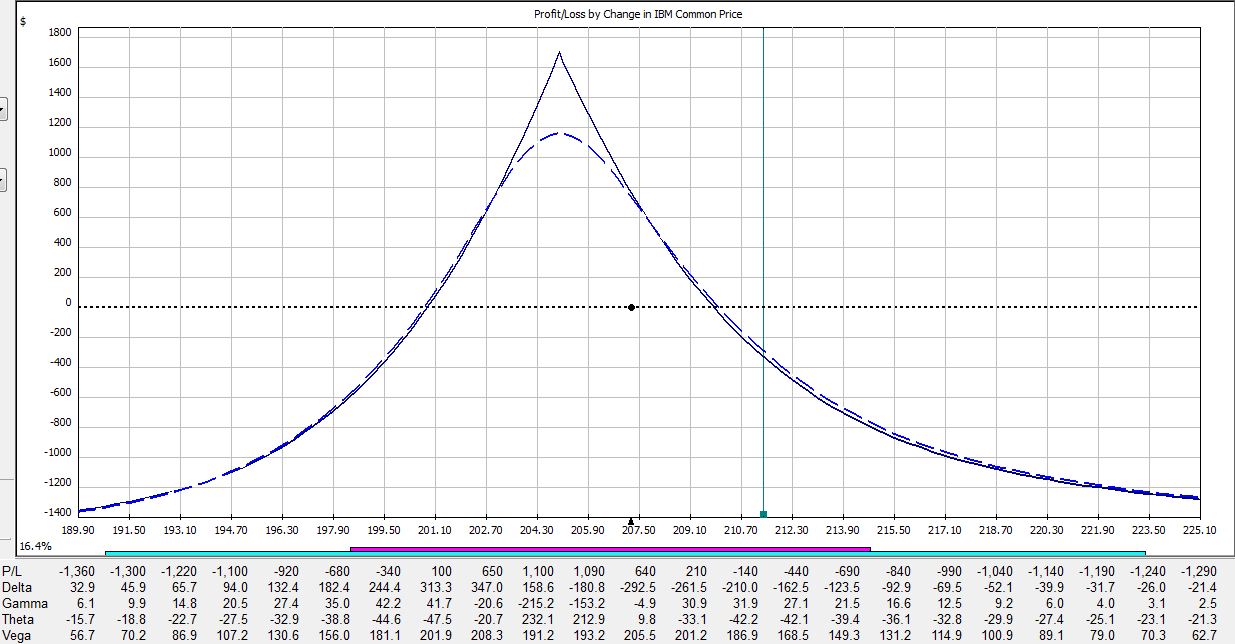
If IBM were to move down 2% then in 21 days the trade would be up $790:
Here is a summary of these changes in percentage return on investment:
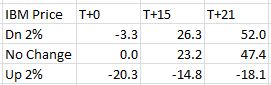
The table says at trade inception, a 2% move in the stock could result in a 20% loss. In just over two weeks, that 2% move in the stock could result in a 38% loss. On the day before option expiration, that 2% move in the stock could result in a 65% loss!
Psychic pain is seeing routine moves in the underlying suddenly have huge effects on the P/L. At some point, many traders would opt to close the trade so as not to worry about this negative gamma risk. Negative gamma risk can keep you up at night.
Graphically, gamma represents how tightly curved the P/L curve is. As option expiration approaches, gamma becomes huge. While many option trades are capable of “home run” sized returns, it’s truly a shot in the dark because normal moves in the underlying may cost you huge chunks of profit.
Tags: trader education | Categories: Option Trading, Uncategorized | Comments (1) | PermalinkSizing Risk (Part I)
Posted by Mark on April 26, 2012 at 10:08 | Last modified: April 26, 2012 10:08In my last post on profit factor (http://www.optionfanatic.com/2012/04/24/introduction-to-profit-factor/), I mentioned that one way to run a viable trading business it to keep the average loss somewhat equivalent to the average gain. Sizing risk is a sneaky impediment to consistent profitability that describes the potential for larger losses with more capital employed and also to the potential for smaller gains with less capital employed.
A typical positive theta option trading plan involves scaling with a 15% profit target and 20% max loss. The trade is initially placed with 1/3 total capital. As the market moves against the trade, another 1/3 of the total capital is deployed as an adjustment. If the market continues to move against the trade, the final 1/3 of capital is deployed.
In periods where the market moves sideways, the trade will hit its profit target with only one-third total capital utilized. In more challenging times, all capital will be deployed. When the 20% max loss is hit, it will be 20% of the full capital deployment. When the profit target is hit, it may be on 33%, 67%, or 100% of total capital allocation depending on whether any scaling was necessary. In effect, then, this trading plan has a max loss of 20% with a profit target of 10% (the average of 33% capital allocation * 15%, 67% capital allocation * 15%, and 100% capital allocation * 15%).
Before I go into why this results in a challenged trading strategy, I need to make a detour. The logical response would be to hold the trade until 15% profit is realized on total capital whether or not total capital is committed.
In my next post, I will begin to traverse this detour with a discussion of negative gamma risk.
Tags: income trading | Categories: Money Management, Option Trading | Comments (2) | Permalink