Trading System #2–Consecutive Directional Close (Part 10)
Posted by Mark on November 27, 2012 at 07:27 | Last modified: November 23, 2012 05:34I am currently in the process of backtesting other broad-based indices with the CDC trading system. In http://www.optionfanatic.com/2012/11/23/trading-system-2-consecutive-directional-close-part-9, I backtested QQQ (Nasdaq 100). Today I will backtest IWM (Russell 2000 small caps).
Once again I will backtest x = 3, 4, 5, 6, 7 and N = 3, 4, 5, 6, 7 with a minimum total trades number of 55 (see http://www.optionfanatic.com/2012/11/16/trading-system-2-consecutive-directional-close-part-5). I will include trade delays for buy and short trades with the understanding that any decent results I get may well be improved in live trading. Here are the results as sorted by subjective function (RAR/MDD):
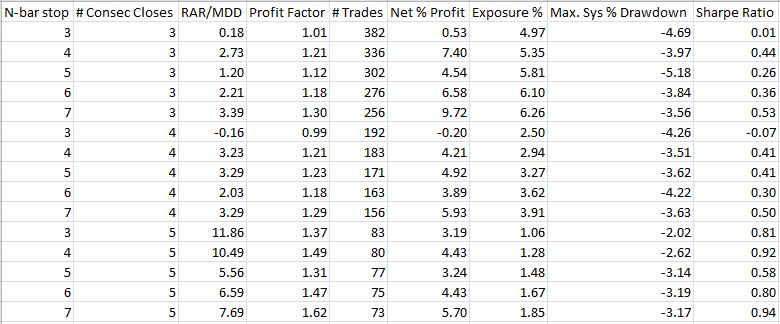
These numbers seem lackluster with a couple systems gaining nothing and most RAR/MDD < 5. As done with SPY and QQQ, I will next backtest long trades only:
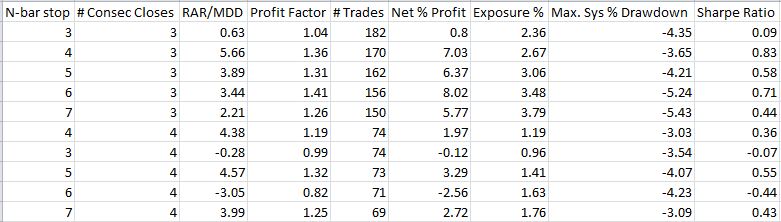
Unlike SPY and QQQ, these numbers are actually worse.
When I see patterns in system development, I really want them to be robust. Why should long-only trades outperform for S&P 500 and Nasdaq stocks but not small caps? I’m sure imaginative types could come up with potential explanations but it makes me skeptical about the pattern since they’re all broad-based indices. If it’s not a real pattern then perhaps I should go back to studying long and short trades together. If the results are not satisfactory for both then perhaps I should waste no more time and move onto the next trading system concept.
This backtesting result has raised many conflicting points worthy of future discussion. I will sleep on it with hopes of a clearer head upon awakening!
Categories: Backtesting | Comments (0) | PermalinkTrading System #2–Consecutive Directional Close (Part 9)
Posted by Mark on November 23, 2012 at 03:18 | Last modified: November 23, 2012 05:03Back in http://www.optionfanatic.com/2012/11/16/trading-system-2-consecutive-directional-close-part-5, when facing an apparent sample size problem I suggested the inclusion of other broad based indices like QQQ and IWM for this trading strategy. It now appears that the problem may not only have been small sample size but also a difference between short and long trade performance. Today I will backtest QQQ.
I will start by backtesting x = 3, 4, 5, 6, 7 and N = 3, 4, 5, 6, 7 with a minimum total number of trades of 55 (see http://www.optionfanatic.com/2012/11/16/trading-system-2-consecutive-directional-close-part-5). In lieu of my last post, I did include trade delays here for buy and short trades. Here are the results as sorted by subjective function (RAR/MDD):
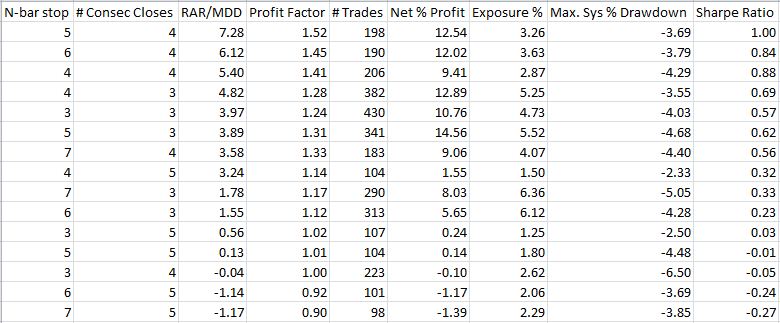
All systems with x = 6 or x = 7 were eliminated due to too few trades.
Compared to other backtesting done so far, these numbers are weak. First, not all systems backtested here are profitable. Second, all RAR/MDD numbers are in the single digits. Third, no PF exceeds 1.60.
Certainly the results would be better with no trade delays but that is not necessarily realistic.
In http://www.optionfanatic.com/2012/11/19/trading-system-2-consecutive-directional-close-part-6, I concluded by suggesting development of the CDC system to continue with long trades only. If I eliminate all short trades:
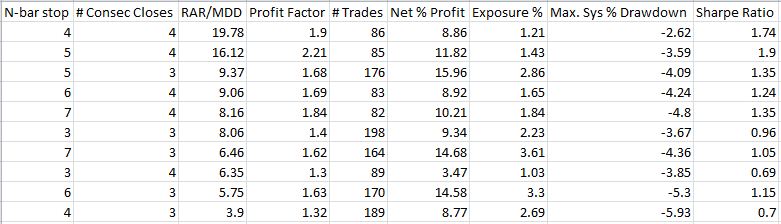
These numbers are an improvement. As a check for consistency/plateau region:
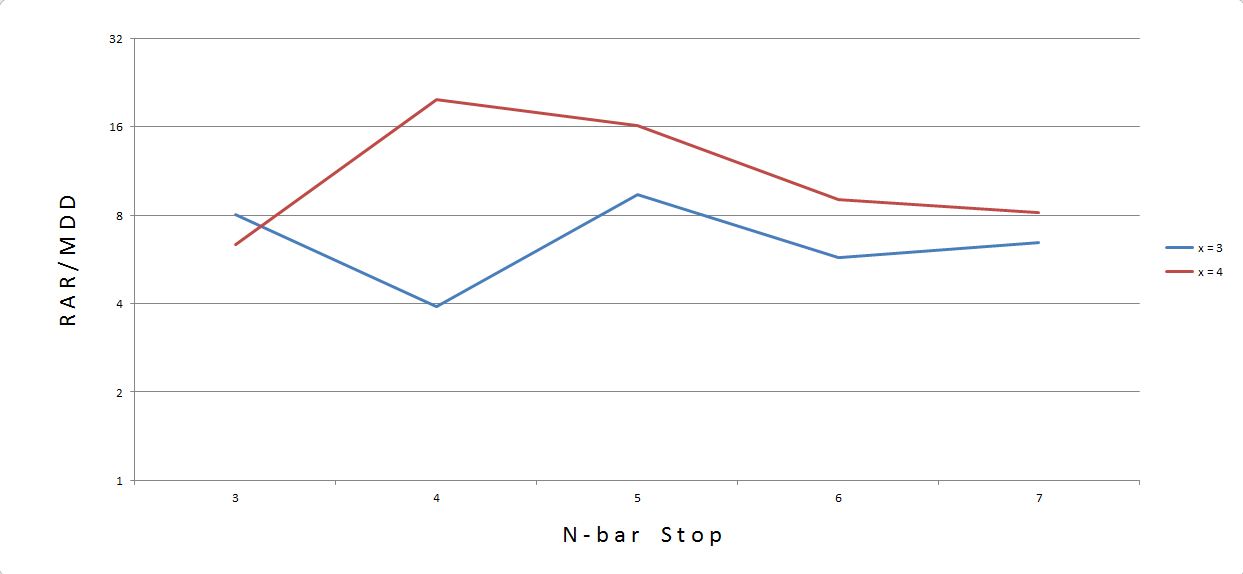
I would trade x = 4 since the red curve is above the blue curve for 80% of the data points (4 out of 5). Furthermore, with a 5-bar stop, I am in a somewhat stable area should performance be a bit better or worse than the backtested curve indicates.
In my next post, I’ll take a look at IWM.
Categories: Backtesting | Comments (1) | PermalinkTrading System #2–Consecutive Directional Close (Part 8)
Posted by Mark on November 21, 2012 at 05:51 | Last modified: November 2, 2012 12:09In http://www.optionfanatic.com/2012/11/20/trading-system-2-consecutive-directional-close-part-7, I found the CDC trading system to perform better without trade delays. Today I want to put this conclusion into perspective.
Even with trade delays, the CDC system is worth pursuing. A mean RAR/MDD of 16.50 and mean profit factor (PF) of 1.90 are worthy enough statistics to shake a stick at.
Furthermore, while it may be necessary in some cases to trade at the next open, in other cases no trade delay will be needed. As an example, consider the CDC system with x = 4 where four consecutive up or down closes triggers a trade. If SPY has closed higher each of the last three days and is currently up 3% with just minutes left in the trading session then I can reasonably proceed with a trade. SPY would have to catastrophically tank in the remaining time to close lower and I know in my experience of watching this market that such an occurrence would truly be a Black Swan. On the other hand, if the market has been choppy all day moving back and forth between positive and negative territory then heading into the close I truly may have no clue whether the final print will be up or down. In this case I will be forced to wait until the following open to trade.
As mentioned above, the CDC system is worth pursuing even with trade delays. At least sometimes if not often, however, trade signals will be clear heading into the close and no delay will be needed. I can therefore interpret these backtesting results to be better than the minimal, yet acceptable, performance numbers mentioned above (i.e. RAR/MDD > 16.50 and PF > 1.90).
Categories: System Development | Comments (0) | PermalinkTrading System #2–Consecutive Directional Close (Part 7)
Posted by Mark on November 20, 2012 at 06:45 | Last modified: November 2, 2012 11:56Is it realistic to think trade signals for a current day can be known before the close and taken on that day to execute at the closing price? I will discuss this in some detail at a later date. Today, I want to incorporate trade delays with the backtesting from http://www.optionfanatic.com/2012/11/19/trading-system-2-consecutive-directional-close-part-6 and see how the results compare.
“No trade delays” means buy, sell, short, and cover signals generated at the close are immediately coupled with trades executed at the closing price. To incorporate trade delays means opening trades (buy and short) will be taken at market open following the signal-generating close.
Here are the results of the same backtesting shown in http://www.optionfanatic.com/2012/11/19/trading-system-2-consecutive-directional-close-part-6 with buy and short trade delays included:
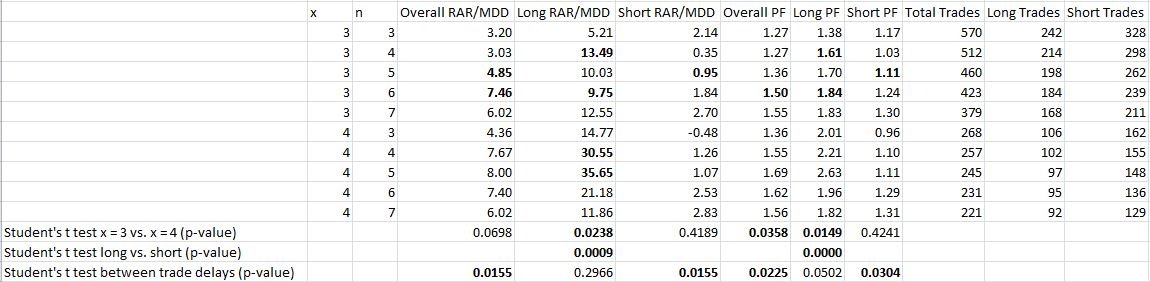
In bold are statistics that are better than no trade delays. For the t test rows (bottom three), bold indicates differences for the one-tailed test at the 0.05 significance level.
These results show persistence of the tendencies seen in http://www.optionfanatic.com/2012/11/19/trading-system-2-consecutive-directional-close-part-6. Performance is significantly better for x = 4 than x = 3 although this difference is less pronounced with the trade delays. Long trades perform significantly better than short trades regardless of trade delays.
Finally, performance without trade delays is better than performance with trade delays at the 0.05 level of significance (one-tailed).
My next post will discuss these results in more detail.
Categories: System Development | Comments (0) | PermalinkTrading System #2–Consecutive Directional Close (Part 6)
Posted by Mark on November 19, 2012 at 03:32 | Last modified: October 31, 2012 13:17In http://www.optionfanatic.com/2012/11/16/trading-system-2-consecutive-directional-close-part-5, I settled on x = 4 and n = 5 as a potentially viable combination with which to trade the Consecutive Directional Close (CDC) system. The next step is to study long vs. short trade performance.
To do this, I used AmiBroker to conduct a series of backtests on the CDC system. I set x = 3, 4 and n = 3, 4, 5, 6, 7, which generated 10 sets of performance statistics:
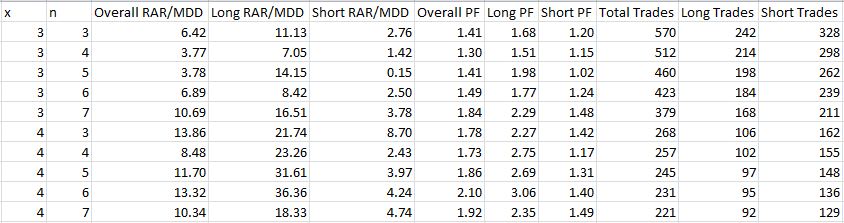
Note the trends in the data. As the conditions get more extreme (higher values of x and n), total number of trades decreases and profitability generally decreases.
In order to directly compare the long trades vs. short trades, I ran a Student’s t test for independent samples. The results are as conclusive as the table appears:

These miniscule p-values suggest statistically significantly differences between the data.
I will continue future CDC system development with long trades only.
Categories: Backtesting | Comments (3) | Permalink
Trading System #2–Consecutive Directional Close (Part 5)
Posted by Mark on November 16, 2012 at 07:04 | Last modified: October 30, 2012 10:07As discussed in http://www.optionfanatic.com/2012/11/15/backtesting-conundrum-with-sp-500-stocks, I have not subscribed to delisted data nor does my database tag for index membership with respective time intervals. I therefore must alter course away from backtesting S&P 500 stocks individually.
I can immediately think of three further directions for the Consecutive Directional Close (CDC) trading system. First, I can explore elimination of the more extreme trading criteria that do not generate sufficient sample sizes. Second, I can explore using long trades only since those seemed to perform better in Table 1 of http://www.optionfanatic.com/2012/11/01/trading-system-2-consecutive-directional-close-part-2. Third, I can incorporate other broad-based indices like QQQ and IWM. I will study these in order.
Eliminating the more extreme trading criteria upholds the old adage “don’t throw the baby out with the bath water.” With an inconclusive graph like Figure 1 in http://www.optionfanatic.com/2012/11/07/trading-system-2-consecutive-directional-close-part-4, my academic background suggests scrapping the hypothesis (system) altogether to research elsewhere. The difference here is that the data do not necessarily fail to fit the hypothesis. Rather, due to the insufficient sample size I am unable to determine whether the data fit the hypothesis.
To draw a line in the sand, I will require at least 55 trades as a minimal sample size (I accepted 57 trades for the SPY VIX system). Revisiting Table 1 from http://www.optionfanatic.com/2012/11/06/trading-system-2-consecutive-directional-close-part-3 then leaves me with:
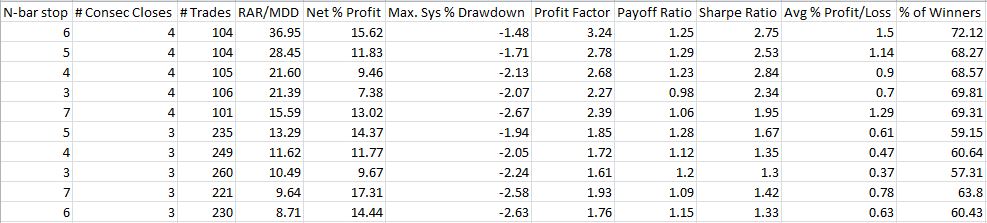
These numbers look pretty good: all 10 systems profitable with profit factors over 1.60, total number of trades in the triple digits, and Sharpe Ratios over 1.00. Graphically, the results look like this:
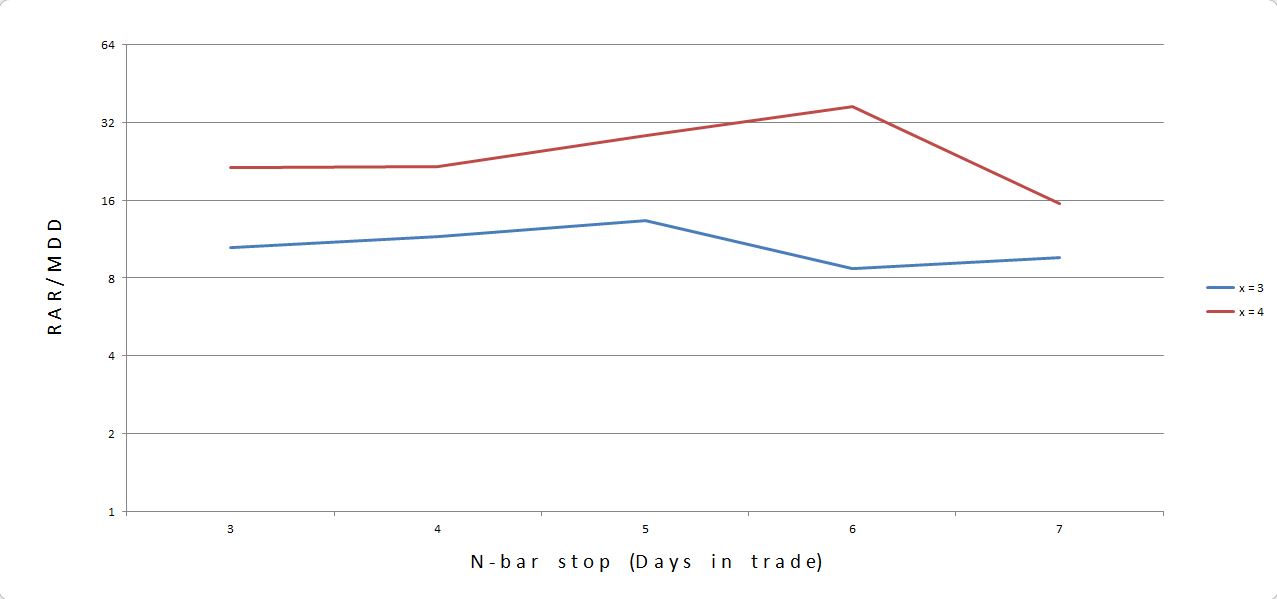
The x = 4 curve is above the x = 3 curve, which corresponds to better results with more CDCs. Furthermore, the curves are relatively flat as viewed in this logarithmic graph. I would choose n = 5 as the middle.
In the next post, I will continue to explore other directions for the CDC system as described above.
Categories: System Development | Comments (2) | PermalinkBacktesting Conundrum with S&P 500 Stocks
Posted by Mark on November 15, 2012 at 04:54 | Last modified: October 30, 2012 06:32I concluded http://www.optionfanatic.com/2012/11/12/position-sizing-implications-of-multiple-open-positions-part-3 by affirming the validity of backtesting S&P 500 member stocks as a proxy for results obtained with SPY. Today I want to address two data challenges with backtesting S&P 500 member stocks.
The first challenge that must be overcome is survivorship bias. Wikipedia explains:
> In finance, survivorship bias is the tendency for failed companies to be excluded
> from performance studies because they no longer exist. It often causes the results
> of studies to skew higher because only companies which were successful enough to
> survive until the end of the period are included.
Bankrupt companies are the quintessential example of survivorship bias. Stocks of bankrupt companies get delisted from the exchange on their way to hitting $0.00/share. Many bankrupt companies were once members of the S&P 500. If I run a backtest on “S&P 500 stocks,” then bankrupt stocks are not going to be included since they are no longer in the database.
The second challenge of backtesting S&P 500 stocks is to accurately manage changes in index composition. Stocks are added and deleted from the S&P 500 on an irregular, but not infrequent basis. If I run a backtest on “S&P 500 stocks” then my database will look at those stocks currently in the S&P 500 folder. That folder is current as of right now but not accurate for historical dates.
To truly serve as a proxy for backtesting SPY, the individual S&P 500 stocks can therefore be used if: 1. the database includes delisted stocks to avoid survivorship bias; 2. The database tags stocks with both index membership and defined time interval(s) during which that index membership took place.
Categories: System Development | Comments (1) | PermalinkPosition Sizing Implications of Multiple Open Positions (Part 3)
Posted by Mark on November 13, 2012 at 05:00 | Last modified: November 14, 2012 05:55In http://www.optionfanatic.com/2012/11/09/position-sizing-implications-of-multiple-open-positions-part-2, I continued exploration of problems presented with trading all S&P 500 stocks individually in lieu of the SPY ETF.
Last but certainly not least is the potential for large portions of capital to be sitting on the sidelines for extended periods depending on how the number of open positions is distributed over time. Suppose a 15-year backtest showed 90 trades to be open on three occasions for five trading days each and 20 positions to be open on average. To allow for a margin of safety, I might allocate for 120 positions. Here is a graphical representation of exposure:
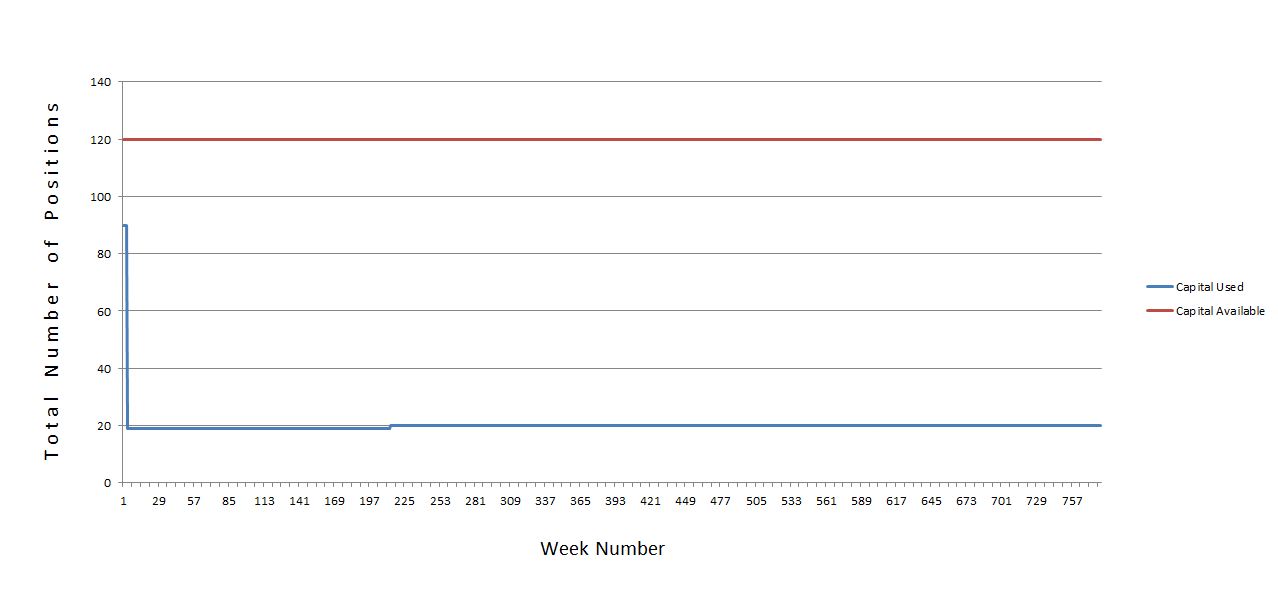
Over 780 weeks (15 years), the space between the blue line and the red line represents capital sitting idle on the sidelines just in case the system ever needs it. That’s a lot of cash doing absolutely nothing but collecting 0.01% interest in today’s market environment.
Given this and the other problems/challenges discussed in the last two blog posts, my gut tells me to throw up my hands and say “forget it!”
Except for one thing. From http://www.optionfanatic.com/2012/11/08/position-sizing-implications-of-multiple-open-positions-part-1:
The goal of backtesting all S&P stocks and combining the results is to obtain data similar to trading SPY alone with a sample size large enough to be meaningful and not subject to outlier distortion. To do this, I will have to take every single trade since SPY is the composite of all 500 tickers.
I am not actually intending to trade all these individual stocks! I’m just trying to get results based on a large enough sample size to validate a SPY trading system. I don’t have to hold multiple positions. I don’t need a $50M account. I can let the computer simulate all this and then interpret the results for all 500 stocks as roughly equivalent (perhaps minus a constant tracking error for management fees) to the SPY ETF alone.
Categories: System Development | Comments (0) | PermalinkPosition Sizing Implications of Multiple Open Positions (Part 2)
Posted by Mark on November 9, 2012 at 05:59 | Last modified: October 26, 2012 13:08I left off http://www.optionfanatic.com/2012/11/08/position-sizing-implications-of-multiple-open-positions-part-1 discussing total financial commitment as a challenge for trading all S&P 500 stocks in lieu of SPY itself. When I look closer, another problem and challenge to system development also comes to the fore.
This second problem is unreasonable total risk. Trading SPY alone could cost $200 when risking 2% per trade on a position size of $10,000. Trading S&P 500 stocks individually means a potential total risk of 500 times that or $100,000. Don’t think for a moment that it couldn’t all be lost in one fell swoop with a sudden and substantial market move.
Rather than entertaining the possibility of 500 open positions at once, I could use the maximum number of open positions ever seen in the backtest. This would probably be fewer than 500. A problem would then arise if at some future time market conditions were to require more open positions than those for which I allocated.
Either possible solution to an instance demanding more open positions than allocation provides would cause problems from a system development perspective. I could simply skip additional trades once I’ve reached my limit. Alternatively, I could implement a rotational system where the top X trades are selected based on selected criteria. Either way, this is a rare and infrequent occurrence. With the total number of instances being so few and far between, the sample size would be too small to determine the trading system impact. To proceed blind without understanding the potential risk would be dangerous at best–this is the whole reason system development incorporates backtesting in the first place.
In an attempt to avoid being forced to open too many positions, I could allocate for more positions than the maximum number of positions ever seen in backtesting. While this would decrease the possibility of sequelae described in the previous paragraph, it certainly does not provide any guarantee.
Next up: a Sci-Fi twist and exciting conclusion.
Categories: System Development | Comments (0) | PermalinkPosition Sizing Implications of Multiple Open Positions (Part 1)
Posted by Mark on November 8, 2012 at 05:03 | Last modified: October 26, 2012 12:42In http://www.optionfanatic.com/2012/11/07/trading-system-2-consecutive-directional-close-part-4, I found sample sizes at the extremes (e.g. x = 5, x = 6, x = 7) too small to be useful in backtesting the Consecutive Directional Close trading system. What if I backtest the component stocks of the S&P 500 rather than SPY itself in an attempt to increase sample size thereby shrinking the error bars and producing more consistent data?
The goal of backtesting all S&P stocks and combining the results is to obtain data similar to trading SPY alone with a sample size large enough to be meaningful and not subject to outlier distortion. To do this, I will have to take every single trade since SPY is the composite of all 500 tickers.
A minimal position size is always required to overcome transaction costs. For example, consider a 2% profit target (reasonable for short-term trades held just a few days) and an $8 commission for each trade:
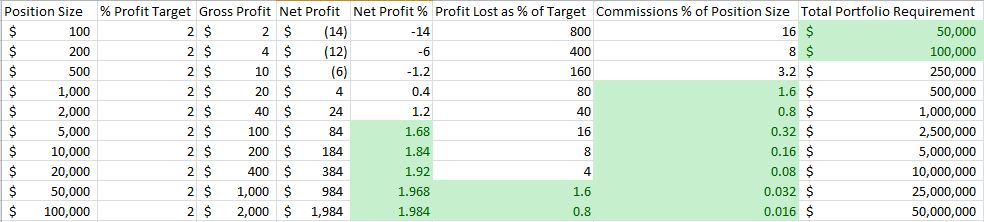
I can measure commissions as a percentage of profit or as a percentage of position size. Shaded in green are values that I, personally, would deem acceptable for each category. The point is that a minimal position size is required to prevent commissions from cutting too much out of profit thereby rendering the system untradeable. I certainly can’t trade a $500 position size, for example, where commissions alone would wipe out my profit target (and then some). In a complete analysis, slippage should also be considered.
The first problem with trading all S&P 500 stocks is an unrealistic total commitment. The “Total Portfolio Requirement” column above is Position Size x 500 since it is possible to have open trades in all 500 S&P stocks at one time. For most retail traders, this minimum capital required to overcome transaction costs becomes prohibitive long before a sufficiently large position size is reached.
I will continue this discussion in the next post.
Categories: System Development | Comments (1) | Permalink