Naked Puts (Part 1)
Posted by Mark on November 20, 2015 at 06:18 | Last modified: October 31, 2015 14:28Like I did for naked calls, today I will start to analyze my data on naked puts.
As an aside, I listened to a podcast this morning by a guy who supposedly trades for a living. He argued most traders fail because they cannot define their trading edge. He emphasized discretionary traders at one point because they are notorious for not having statistics to back their methodology.
I agree with that because usually with discretionary trading, parameters are not the same from one trade to the next. A set of guidelines might have a range over which action should be taken. An infinite number of possible trades may result depending on where action is ultimately taken and “gut instinct” is usually the deciding factor.
The goal of this post is to put some context around naked puts and try to determine whether they provide an edge.
I backtested from January 2, 2001, through October 2, 2015: 3,695 trades total.
87.8% trades (3,253) won.
12.2% trades (452) lost.
Mean days in trade was 27.6 with a standard deviation of 10.6.
Mean profit on 2,760 trades was $14,585 with a standard deviation of $1,929.
Mean days in winning trade was 29.7 with a standard deviation of 9.45.
Mean loss on 452 trades was $47,833 with a standard deviation of $17,551.
Mean days in losing trade was 17.1 with a standard deviation of 10.9.
Average trade: $6,970
Average annual profit: $92,257
Profit factor: 2.19
Really?
The relative magnitude of most of these dollar amounts is not so important. I backtested this with a position size four times larger than that of the naked calls.
One system statistic that I think speaks volumes is the 2.19. This is definitely worthy of a second look.
Categories: Backtesting | Comments (0) | PermalinkBacktesting Methodology (Part 2)
Posted by Mark on November 17, 2015 at 05:46 | Last modified: October 31, 2015 14:24A common approach to option backtesting often falls prey to insufficient sample size. The second big problem I see with most backtesting is potential invalidation by serendipity.
Yes serendipity, which is defined as “the occurrence and development of events by chance in a happy or beneficial way.”
Consider the following example. Suppose someone backtests a strategy over the last 10 years and starts each trade with 45 days to expiration (DTE). This would be a typical monthly trade similar to the naked calls strategy, which averaged 24.39 days/trade.
If the backtesting looks good then s/he is excited (a la “happy or beneficial way,” above) because s/he has encouraging results after studying 10 whole years!
Is it conceivable that if they started the trade with 44 DTE then the results might not look so good? Yes. It’s also possible the results might look downright ugly.
What if they started the trade with 46, 43, or 47 DTE? What about 40 DTE? 50 DTE?
People have tried to claim that certain days are the best/worst to trade and I suspect nothing is farther from the truth. Until I see such a claim statistically validated, I will consider all days to be equivalent. On a historical stock chart they all reduce to bars or candles. A study that performs well on 45 DTE better look good across a range of possible starting dates. If it doesn’t then go ahead and trade it with your money but I certainly will not be gambling with mine.
Put another way, if the other days aren’t looked at or included then I don’t think the backtesting amounts to a hill of beans. They should all be similar and if results look good on some days and bad on others then maybe the encouraging ones are simply due to chance.
This is why I backtested from 2001 through 2015 inclusive for a sample size approaching 3,700. I based my conclusions not on a particular starting date but on the average of all trades taken together.
Categories: Backtesting | Comments (0) | PermalinkBacktesting Methodology (Part 1)
Posted by Mark on November 13, 2015 at 06:44 | Last modified: October 31, 2015 12:41I don’t feel the backtesting statistics do the data justice without some explanation of the study methodology.
One of the most common approaches I have seen to option backtesting is to start trades on a particular day. I have seen people start backtested trades with 45 days to expiration, 36 days to expiration, or on the first trading day of every month.
One potential problem I see here is insufficient sample size. Traditionally, people could go back a number of years with a backtest and only have a sample size equating to 12 times the number of years. More recently with weekly options, sample sizes can be 4+ times greater but only if the strategy is a weekly strategy. Because WeeklysSM are considered by many to carry excessive risk, I believe monthly trades are much more common.
Exactly what is an adequate sample size, then? I’ll go with: 1. I don’t know; 2. It depends (on the particular situation). I really want to lean toward the latter and say “whatever sample size is sufficient for statistical significance.” The question would then be whether a statistically significant result is practically significant.
Based on my experience, traders are notorious for using insufficient sample sizes in backtesting and live trading. I’ve seen plenty of people backtest a monthly option trade for 1-3 years. With 12-36 occurrences, this hardly strikes me as sufficient! Perhaps my favorite example comes from traders trying to apply technical analysis (TA). For example, this comes courtesy of the Twittosphere (names blacked out to protect the “innocent”):
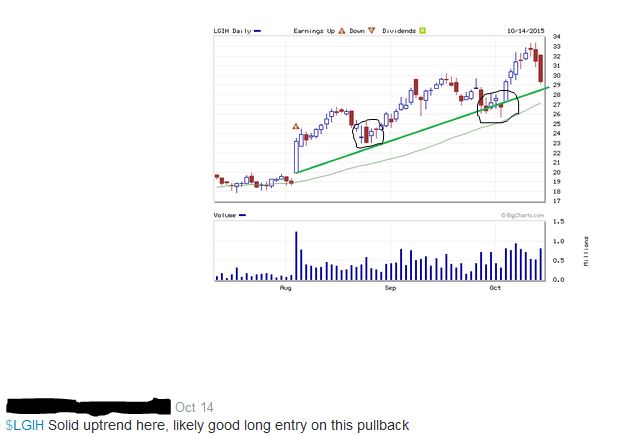
Obviously (according to TA) the long trade is “likely good” here because each of the previous times the stock has pulled back to the positively-sloped green line, it has moved higher. How many times was that? Look closely to make sure you count them all (circled): one, two… TWO!
Oh wait… only two?
How many days does it take to make a habit: 21? 30? 66? Certainly not two… you get the idea.
But wait: there’s more! I will continue in the next post.
Categories: Backtesting | Comments (1) | PermalinkNaked Calls
Posted by Mark on November 10, 2015 at 07:14 | Last modified: October 31, 2015 12:18I have spent many hours backtesting naked calls and I now want to analyze these data. The question I ultimately look to answer is whether this trading approach offers any edge.
I backtested from January 2, 2001, through September 21, 2015: 3,695 trades total.
74.7% trades (2,760) won.
25.3% trades (935) lost.
Mean days in trade was 24.39 with a standard deviation of 11.87.
Mean profit on 2,760 trades was $2,994.65 with a standard deviation of $835.
Mean days in winning trade was 25.92 with a standard deviation of 11.12.
Mean loss on 935 trades was $9,601.91 with a standard deviation of $3,420.
Mean days in losing trade was 19.87 with a standard deviation of 12.82.
Average trade: -$192.84
Average annual loss: -$2,886.20
Profit factor: 0.92
To say “this does not seem very encouraging” is understatement of which even Ernest Hemingway would be proud.
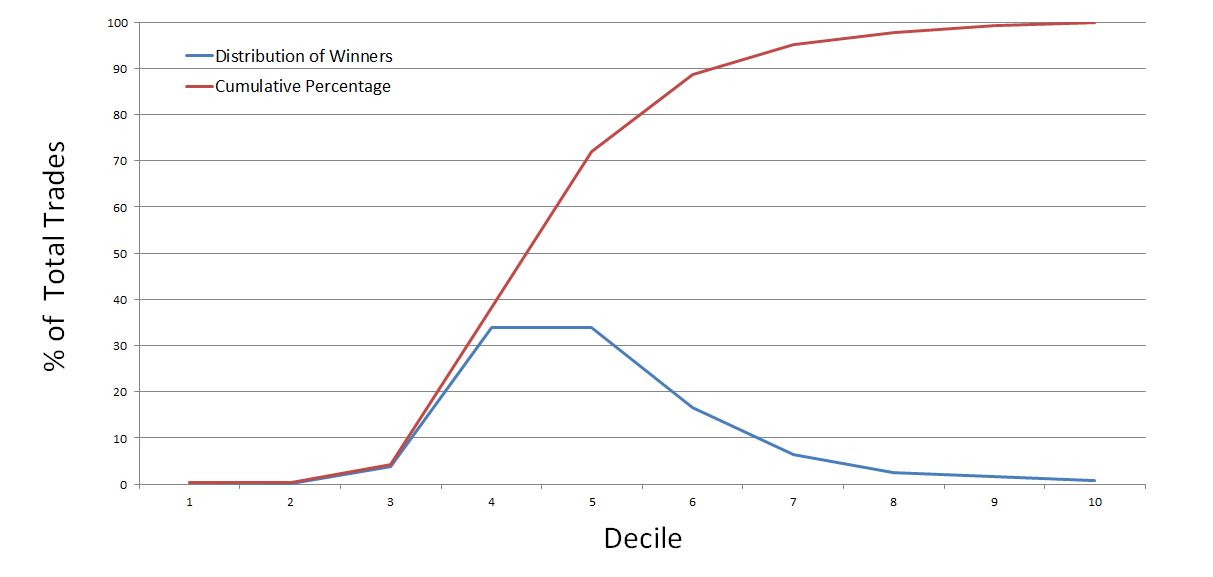
The graph below shows the distribution of winning trades:
The graph below shows the distribution of losing trades:
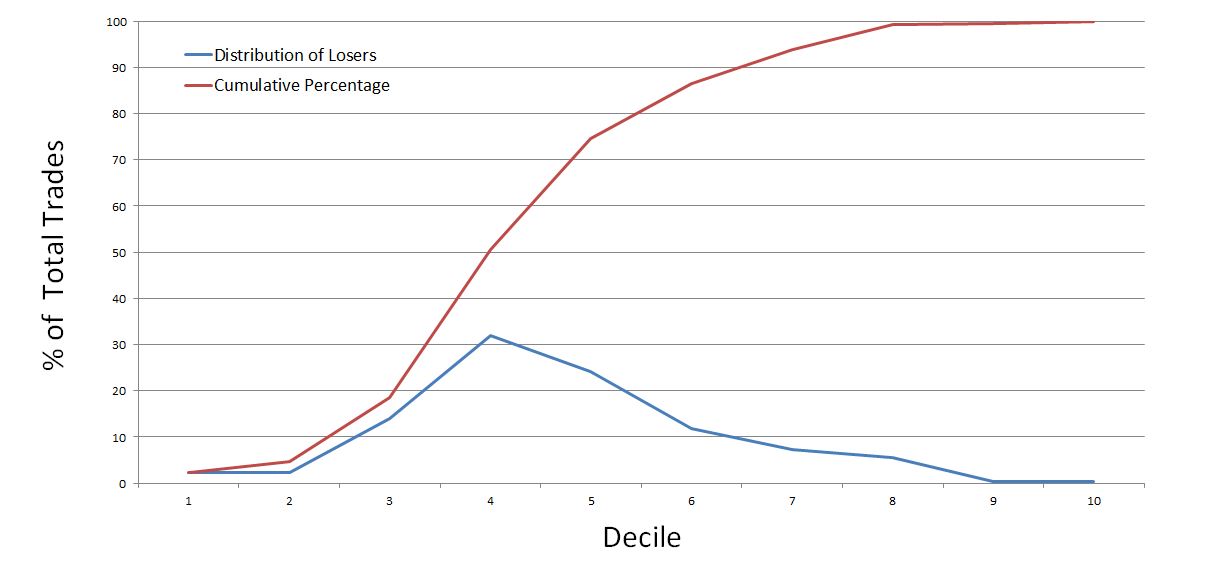
Do you see anything here that might offer even the slightest of hope?
I do find it interesting that the four deciles of largest losses (in excess of $13,584 per trade) account for less than 14% of the losing trades.
Intuitively, I’d like to see this significantly larger than the four deciles of largest gains (in excess of $4,624 per trade) but those account for a comparable amount at 11.4% of the winning trades.
A couple other observations further dim the light on hope. First, the losses are not maximum adverse excursion (MAE): the practical statistic that really matters. Second, it’s important to note this was an end-of-day backtest, which means results can be lumpy. A trade can go from decile 2 to decile 7-10 in a single day.
I may run the MAE analysis later but I really have little hope for a system with a negative expectancy to start (profit factor < 1.0).
Categories: Backtesting | Comments (3) | PermalinkUnderstanding Dividends (Part 3)
Posted by Mark on November 6, 2015 at 05:11 | Last modified: October 29, 2015 09:11Let’s go back to the theory that capital appreciation and dividend income are two sides of the same coin.
Were this theory found to be true, something would strike me as very wrong because the financial industry significantly emphasizes a difference between these investment objectives.
Even in this case, I did think of one marketable difference in favor of dividends. I could, in effect, make a non-dividend stock into a dividend-paying stock by periodically selling shares for cash. I would have to pay a commission with each stock sale, though. The commissions amount to money lost and I don’t see a clear way around it. I wrote earlier about synthetic equivalents in Finance. Equivalents are truly identical whereas the commissions make this different. I could try to argue “companies incur significant administrative fees when paying dividends to all those shareholders on a periodic basis and these fees cut into their cash on hand, make the company worth less, etc.,” but: 1) as a total percentage of cash on hand, this is probably minuscule; 2) to suggest the decreased cash commands a lower stock price is another theoretical concept and one I doubt could even be tested (too small to detect).
So for someone who does need money periodically to pay the bills, even in the hypothetical case that dividends are nothing more than future capital appreciation realized right away, I do see benefits to that dividend check. Is this worth the significant growth/income difference affirmed by the industry with regard to the suitability standard? I think that is highly debatable but I would be much more enraged about the construct if I could come up with no difference at all.
And because I no longer believe dividend income and capital appreciation to be the same anyway, once again “FAHGETTABOUDIT!” is in order.
Categories: Financial Literacy | Comments (0) | PermalinkUnderstanding Dividends (Part 2)
Posted by Mark on November 5, 2015 at 07:56 | Last modified: October 28, 2015 10:35I now believe dividends are bona fide income that
Hypothetically speaking, suppose I did the study and found dividends are future capital appreciation realized now. I cannot emphasize enough [to myself] that this is not necessarily the case.
Nevertheless, I think understanding whether investors realize a decrease in stock price offsets the dividend would be very important for determining whether it’s a bunch of financial hocus-pocus.
I asked a former director of a NYSE-listed utility company. He said yes: most savvy investors know this.
He continued on: “sometimes the stock price falls some but sometimes it doesn’t. The stock usually falls less than 1%. Investors like the stability. They get the dividend checks in the mail and they feel good about that.”
I corrected him by saying the stock falls by exactly the amount of the dividend and that is cumulative over all dividend payments (a claim I now know to be theoretical). I said total return is equal whether or not a dividend would be paid.
He said, “most investors don’t know the term ‘total return.’ People want their dividend and their cash now and that’s it.”
I argued, “we could do a study to determine whether dividend payers are more stable than non-dividend payers. It’s a hypothetical claim that we don’t know the answer to.”
He said, “stock splits are the same way and stock splits are just like dividends. Companies with stocks that split are more healthy than those that don’t. Stock splits and dividends are both signs of corporate health.”
At the very least, I came away from this discussion thinking dividends are a marketing tactic by corporate boards of directors to make a stock more appealing to a particular segment of investors. Stock splits are the same way: neither change the total value of the investment. What a crock, then, for the industry to emphasize so strongly the illusory difference between capital appreciation vs. income!
Since the conclusion is based on a hypothetical premise, though, an enthusiastic “FAHGETTABOUDIT!” is in order.
Categories: Financial Literacy | Comments (0) | PermalinkUnderstanding Dividends (Part 1)
Posted by Mark on November 2, 2015 at 07:06 | Last modified: October 28, 2015 10:04I can imagine someone reading the first few posts of this mini-series and saying “okay I can see why you say there’s something misleading about dividend payments but you can’t argue that it’s income.”
A proponent of dividends might take issue with my claim that capital appreciation and income are two sides of the same coin. According to my brokerage (customer support), on the ex-dividend date the exchange lowers the price of the stock on the ex-dividend date. Were the dividends not paid, I claimed the stock would be higher by the amount of the total dividends paid. As logical as that seems, it is only hypothetical. The devil’s advocate could argue “because dividend payments are usually much lower than the average daily volatility of the stock, the impact of the dividend probably comes out in the wash.”
Designing a study to substantiate my claim would be very difficult. I would have to get intraday data and study stock price changes just after the price is reset. I would also have to use something other than an adjusted price series because when dividends are paid, all previous prices in an adjusted series are adjusted downward by the amount of the dividend. Determining a valid control group might be difficult, too. I could use non-dividend payers or any stock not paying a dividend on that day. I could probably ramp up the sample size large enough for statistical significance but would it be financially significant? Maybe not.
I can’t think of an easy way to do this study and I certainly don’t have access to the data to do it myself. I therefore must drop the claim that dividend payment comes directly at the cost of capital appreciation.
The only thing I know for sure is that the “[income] check is in the mail.” While I know for sure that the stock price is decreased, I do not know whether I will even see the difference. That gives it significantly less impact than a periodic dividend payment, which may be cashed in at the local bank.
Categories: Financial Literacy | Comments (1) | PermalinkAre Dividends Income? (Part 2)
Posted by Mark on October 21, 2015 at 06:43 | Last modified: October 26, 2015 11:46Since it’s 3-0, I’m not categorizing this as optionScam.com anymore. Nevertheless, I still have a problem with the dividend concept so I’m going to approach this debate from a different angle.
The financial industry is focused heavily on “the suitability standard.” When I pay someone for financial advice, the investment professional must make recommendations tailored to my personal situation. This is a Rule (2111) of the Financial Industry Regulatory Authority. For this reason, advisers compile an investment profile that includes:
- Client age
- Other investments
- Financial situation and needs, which includes questions about annual income and net worth
- Investment objectives (e.g. generating income, preserving wealth, or market speculation)
- Investment experience
- Investment time horizon
- Liquidity needs (i.e. withdrawal of cash to fund living expenses without incurring significant loss)
- Risk tolerance (discussed here)
Investment objectives may include growth and/or income.
Growth means capital appreciation, which according to Investopedia is:
> A rise in the value of an asset based on a rise in market price.
In other words, the positive difference between current stock price and the price of the stock when I bought it. Reading on:
> Capital appreciation is one of the two main sources of investment
> returns, with the other being dividend or interest income.
The kicker to all this is what happens to the share price when a dividend is paid.
Do you know? This is not a secret but I suspect it is not common knowledge especially to the layperson. I went to a presentation on dividends the other night and it was not even mentioned until I asked about it.
When a dividend is paid, the price of the stock decreases by the dividend amount.
From an accounting standpoint this makes complete sense. If stock XYZ pays out $100M as a dividend then it would make no sense for the market capitalization to be unchanged. The number of outstanding shares does not change so the loss is reflected in a lower share price.
Sleep on this for a night or two because I’m going to come with this pretty hard in the next installment.
Categories: Financial Literacy | Comments (1) | Permalink