Like Statistical Minds?
Posted by Mark on May 13, 2016 at 06:21 | Last modified: March 31, 2016 06:51Several weeks ago I listened to a presentation by David Wilt, co-founder of QuantyCarlo [QC], and for perhaps the first time in the option trading space, I heard what sounded like a kindred spirit. Today I will post some excerpts.
“With this tool you can propose a set of values for DTE, study them, and then evaluate
them: which gives you the best results and whether or not—and this is tremendously
important—any of those results are statistically significant or whether you are simply
looking at the random, stochastic behavior of trades in a sample space.”
“Desirability index is a standard method in inferential statistics and modeling—a single
measure (from 0 to 1) that reflects outcomes of interest to you.”
“When we have results from any kind of backtest… the first question you have to answer
is whether results are statistically significant: can you feel comfortable that when you
trade live you will get similar results?”
“QC Enterprise… provides you with a statistically sound (scientifically sound means to
provide significant, predictable, reliable improvements)…”
“I am absolutely convinced that 20-30 years from now, people will look back on this
and say ‘well that was easy. That was a no-brainer.’ I think what we’re really doing
here is taking a series of methods and techniques that have been applied in other
industries and bringing them to the options trading space and what we have here
is a tool that allows us to do the tests fast enough and sufficiently enough to
apply these statistical models and give us the kind of predictive capability that
has been achieved in other industries.”
“We want to get this in front of the people because there are a huge number of
smart people out there. We believe strongly that if we can engage them… if
they will share with us their views of QC: good, bad, or indifferent… if we
can learn from them then we will be able to continuously enhance this product.
The engagement with folks and the learning that we can anticipate from engaging
with them is invaluable and we appreciate the time and we appreciate people’s
questions and we appreciate their comments because that’s so important to
making this product and making the community more successful and I think
that’s really what we’d like to see. So I want to personally thank everybody
and say I look forward to the continued dialogue and I’m sure… QC [will] be
better for it.”
I look forward to learning more about QuantyCarlo!
Categories: Trading Software | Comments (0) | PermalinkWatching Out for Risk
Posted by Mark on May 10, 2016 at 06:46 | Last modified: March 28, 2016 09:16Many of my blog posts are inspired by forum discussions I have with other traders because thoughts had by others are often thoughts I once had too. Today’s example is about risk.
Over a year ago I was compelled to respond to “Pete,” a guy who had some definitive, optimistic words for trading strategies he claimed to be using. He posted a number of times before I responded with the following:
> If there’s potential reward then there is no such thing
> as zero risk.
>
> Your posts have full of phrases like:
>
> –“consistent weekly profits”
> –“‘gravy’ forever into the next generation”
> –“the coast is clear to keep it and make premiums
> until it runs up again”
> –“those who stayed are rich and retiring”
> –“sounds to me like profit all day long and all
> the way to the bank”
> –“this is a triple grand slam with insurance.”
>
> Where’s the one about trading being like an ATM
> machine that continuously spits out cash?
>
> Nothing about trading or investing is free, nothing
> is guaranteed, and nothing here is ever worth the
> kind of exuberance you seem to project with your
> posts. There’s risk inherent with everything and
> if you trade too large aiming to be too greedy then
> you will one day learn the hard way by getting
> blown out of the game for good.
Pete responded by asking me what I felt could possibly be wrong with some of the trades he was putting on. I replied:
> I’m not going to specifically analyze the pros/cons
> of your trade because we have other wonderful
> traders here who routinely share such insights
> Hopefully they can help with some of your analysis.
>
> Based on my real-world trading experience, though,
> focus on what I said in my last post. It’s at
> least urban legend (if not definitive truth: nobody
> knows) that over 80% of all traders lose money.
> Personally, I think the #1 culprit is unrealistic
> expectations. If you enter the markets thinking
> you’re going to make too much per month then
> you’re going to get beheaded. Your phrases that I
> quoted all suggest just that.
>
> Hence my caution: learn how to determine the real
> risk, watch your back, and be careful. If you don’t
> see the risk then walk (or run) far away.
I think this is good advice for everybody and that includes, first and foremost, myself. I try to remember this stuff each and every day.
Categories: Money Management | Comments (0) | PermalinkFixed Position Sizing in Trading System Development
Posted by Mark on May 5, 2016 at 06:20 | Last modified: March 24, 2016 12:31I have mentioned the importance of fixed position sizing on multiple occasions. Today I want to present another example.
Here is a table showing performance of five different investing strategies. Which one is the best?
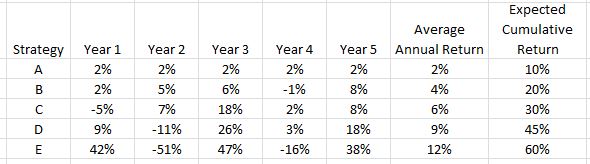
Do you agree with E > D > C > B > A?
This assumes fixed position sizing. No matter how good or bad the strategy does in any given year, fixed position sizing means I risk the same amount for the following year. This is not typically how longer-term investing is modeled. You’ve probably seen the compound growth curve that so many investing firms and newsletters like to market:
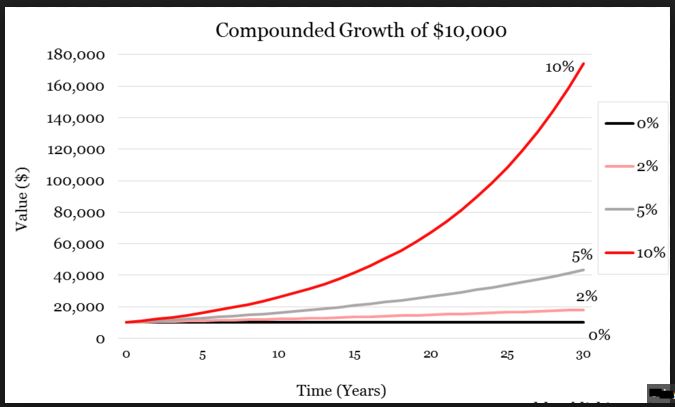
I will not get curves like this by doing the math shown under the “Expected Cumulative Return” column. Beautiful exponential curves are only possible if I remain fully invested. As the account grows, my position size grows. Exponential returns are not a by-product of fixed position sizing.
Following a fully-invested, compound-returns financial plan will generate the following from our five investing strategies:
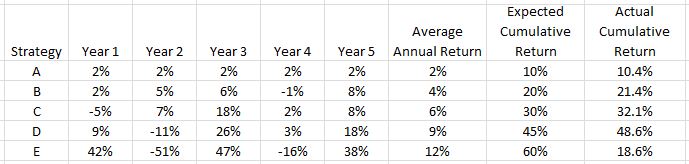
Now it seems the investment strategies should be ranked D > C > B > E > A. Note how the mighty (E) has fallen! This is the risk of trying to compound returns. Big percentage losses early leave a small amount in the account to grow when the strategy performs well. Big percentage losses late when account equity is at all-time highs have the biggest gross impact.
So which strategy is best?
We must first determine whether fixed or variable position sizing is used to better understand what we are looking at.
One additional column presents some revealing information:
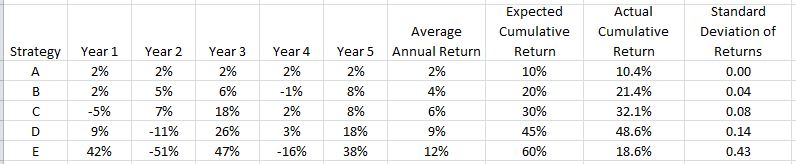
E, the strategy that initially looked best but proved to be rather poor, has by far the highest standard deviation (SD) of returns. SD measures variability of returns. This is why the Sharpe Ratio—a performance measure where higher is better—has SD in the denominator.
In summary, when comparing performance higher average annual returns are better but only to a point. Returns must also be consistent because excess variability can be detrimental. This is why I often study maximum drawdown: the kind of variability capable of keeping me up at night and causing me to bail out of a strategy at the worst possible time.
Categories: System Development | Comments (1) | PermalinkDay Trader Meetup Review (Part 3)
Posted by Mark on May 2, 2016 at 05:58 | Last modified: March 4, 2016 12:46Today I will conclude my review of the first day trader Meetup.
Once we finally got around the table and through the introductions, the organizer took 15 minutes to present one strategy and a few other slides. We then got to eating and talking among ourselves. It seems like a good group of people. Being filled with newbies, I think the group could benefit from some basic presentation about trading. This would include some teaching on trading system development, countering heuristic thinking tendencies, and general tenets of optionScam.com.
Later that evening, WM posted a comment on the website:
> I came to a day trading group with undesired long term ideas. I
> then tried to force them on the group. SORRY won’t happen again.
My intent was not to make this guy feel bad but rather to teach him something. I figured that unfortunately, he would just go on studying Hurst and continuing to get nowhere. WM is like the occasional entrepreneur we see on Shark Tank who has spent a huge amount of money [and time] trying to develop a product/business. Without revenue the Sharks often shake their heads and say things like “this is just a bad idea,” or “cut your losses already and move onto something else.”
The Holy Grail is advertised and marketed in many places. I firmly believe it is myth and only capable of impeding my progress by draining resources. One way I avoid this trap is to steer clear of anything too complex. In WM’s case, the advanced theoretical math is literally way over his head. Anything “proprietary” is also too complex for me because by definition, I will never know what it is.
A second Meetup was held a few weeks later on a Wednesday evening and only three of us (WM, the organizer, and myself) showed up. Yes, WM was still trying to preach Hurst theories and he eventually stood up and said “thanks guys but this group just isn’t for me.” I think he’s too brainwashed to contribute but I do hope others attend future Meetups.
Categories: Networking, Trader Ego | Comments (0) | PermalinkDay Trader Meetup Review (Part 2)
Posted by Mark on April 29, 2016 at 06:36 | Last modified: March 4, 2016 11:48Last time I praised the organizer of this new Meetup for being a humble, normal guy. Despite his best intentions, we were not spared from blind ego supplied by someone else in attendance.
Like Mr. Know-It-All and our friend DY, let me introduce you to WM. Before the meeting, he posted on the website, “Everyone should check out J M Hurst. He discovered how the market works by using electrical engineering math.”
The Meetup started with the organizer having everyone introduce themselves. WM began by taking 5-10 minutes to explain how Hurst has figured out the markets with his engineering math. He said this works for all markets including stocks, commodities, futures, and currencies: “if you analyze the data then you will see for yourself!”
Since my turn was next, I looked WM squarely in the eye and said “I tend to be skeptical so we will probably do some arguing later on.”
For 30 minutes out of the two hours, we did just that. I started by asking WM whether he is making good money with Hurst’s methods. He said no. I asked if WM’s level of sophistication is sufficient to understand the complex math behind Hurst’s methods. He said no. I asked if WM could reliably predict the future price move on some random charts by applying Hurst’s methods. He hemmed and hawed then failed at several attempts.
WM tried to defend himself by saying “I don’t understand Hurst’s teachings but I have no doubt that a group of us can combine our efforts and make great money.” My blood was boiling and I couldn’t help but raise my voice in talking to him because I felt he wasted so much of our time.
WM reminded me of entrepreneurs appearing on “Shark Tank” with outrageous valuations for their pre-revenue companies. Revenue is proof the product can sell. Without revenue there is little value. Unless WM had been successful making money the Hurst way, we have no reason to think anyone can. Why is he trying to sell it as the Holy Grail? How would he know?!
I am a fool destined for the poorhouse if I have blind faith in matters related to trading and investing.
Categories: Financial Literacy | Comments (1) | PermalinkDay Trader Meetup Review (Part 1)
Posted by Mark on April 26, 2016 at 07:25 | Last modified: March 2, 2016 08:48A couple months ago I went to a new Meetup for day traders. This is only the second such group I have seen in the state. The other one has a few hundred members but has been inactive for years. The organizers are franchisees of a well-known national trading school that I believe to be a spam-filled money pit. I had met the organizer of the current Meetup twice in the past so I was interested to see what he put together.
I made my way through the wintery cold on a Saturday afternoon to a quaint, Italian restaurant close to downtown. Eight attendees sat around a table with a TV monitor in the room. Two out of the eight seemed to trade stocks regularly but only the organizer was a consistent day trader.
I give props to the organizer for his humility. He claims to make some money day trading but does not profess to make a lot. He said last year he made $30K but lost $10-20K. He’s looking to become more consistent and to that end he started this group as a means to exchange ideas with others. With a smile, he describes himself as lazy: he wakes up in the morning, sets his entries/exits, and then goes back to sleep. He once told me he hits the bars most nights.
Yes, I am giving props to a guy who doesn’t make much because he prefers to be out late drinking on weeknights!
To me this represents something more insidious about the whole lot of retail traders: we aren’t perfect! Nobody is. So why do I get the marketing/advertising face of positivity, of triumph, and of ego all too often when hearing other traders talk? People sound like they’ve expertly got things all figured out. People try to sell others or to garner a following. You’ve seen me write about this time and time and time again.
No, there’s nothing particular about this organizer. He seemed to be a typical, John Doe type of guy.
If only the story would end right there…
Categories: Trader Ego | Comments (1) | PermalinkAccuracy of the Expected Move (Part 2)
Posted by Mark on April 21, 2016 at 06:54 | Last modified: March 31, 2016 05:19I previously reprinted a post from a trading forum along with my response from last year.
The original poster says the ATM straddle is a poor estimate for the Expected Move. What irked me was that he provided no data to support this claim. Had he done a large number of trades? Had he studied it? In case he did, I asked in my response who had done the backtesting on it. He did not respond.
Tasty Trade offers a specific definition of Expected Move: 85% of the value of the front month at-the-money (ATM) straddle OR the arithmetic mean of ATM straddle and the nearest OTM strangle. How do they know that is what people expect, though? They really don’t and they really can’t. It’s not like they surveyed a large sample of people to find out what size move is expected.
A deeper understanding of options does offer some association between the name and the definition. The straddle/strangle will profit on a move in either direction greater than its original price. If traders, in general, think the move will be larger (smaller) than the cost of the straddle/strangle then they will buy (sell) it. The net result of these supply/demand pressures will be the price. Theoretically speaking, then, one could say it reflects what size move traders are expecting.
In the past, I heard more discussion about “implied move.” I have no reservations about the word implied. “Expected” is potentially a misnomer because it connotes some intelligence is explicitly regarding this as likely to happen. We don’t know why traders are buying or selling those options, though, or how many of them even have anything to do with the straddle/strangle itself: they may be components of different positions.
Going back to the top, whether the Expected Move has any predictive value is a completely different question that lends itself to backtesting. Tasty Trade has since done some backtesting to suggest the actual move is usually smaller than Expected. This would be an instance of “herd instinct” and why it might pay to be contrarian.
Categories: Financial Literacy | Comments (1) | PermalinkAccuracy of the Expected Move (Part 1)
Posted by Mark on April 18, 2016 at 07:19 | Last modified: March 23, 2016 08:51Last year, the following post appeared in a trading forum I follow:
> Using ATM straddles to estimate expected moves is
> very inaccurate, to say the least. I remember seeing
> this in some “beginner’s tips and shortcuts”
> resources years ago.
>
> For those interested in a more accurate, but still a
> quick-and-dirty estimation:
> https://www.tastytrade.com/tt/learn/expected-move
>
> You could always go more advanced and use a tool
> like Hoadley’s and GARCH(1,1) model. Or just use TOS
> IV numbers and Analyze tab to keep it simple.
I responded with the following:
> I don’t mean to sound critical but I think you
> bring up a couple good points worthy of
> discussion.
>
> Who knows how good either ATM straddles or
> any other formula is to estimate expected moves?
> In other words, who has done the research to
> study it?
>
> I’m guessing there are traders who have
> backtested this. I am not aware of backtesting
> data targeted for the public domain before
> Tasty Trade (TT). TT studies actual vs.
> expected moves all the time. I’m not sure if
> they’ve looked at ATM straddles vs. any other
> approach (like average of ATM straddle and one
> strike OTM strangle), though.
>
> A separate question from what is a good estimate
> is what is the expected move? The answer to
> this is whatever “most people” (or the “loudest
> talking heads”) regard as the expected move.
> In most cases, I think this is terminology that
> many people throw around casually without
> precisely defining. In most cases too, I think
> most people hear the term and think they
> understand even though they probably don’t
> because the definitions aren’t given.
>
> There’s a lot of crap in the Financial
> [trading/education] space that is neither
> actionable nor reliable. I believe we’re
> even bombarded with such information in
> this forum. That’s not to say forums like this
> aren’t worth reading though. Between the
> cracks, people do offer up some really good
> ideas every now and then.
I will conclude next time with a bit more commentary on this subject.
Categories: Financial Literacy | Comments (1) | PermalinkFixed Credit vs. Fixed Delta
Posted by Mark on April 15, 2016 at 07:08 | Last modified: March 22, 2016 10:13The issue of fixed credit vs. fixed delta has come up a couple times recently including the previous blog series.
I used fixed credit when backtesting naked puts. Fixing credit rather than delta means short delta decreases as the underlying price goes higher. This boosts probability of profit (PP).
Fixed credit may be apples-to-oranges because an increased PP over time means fewer losses. This will likely result in more linearity to the equity curve as underlying price increases. In other words, as time goes on the system may work better for no reason attributable to the strategy itself. Compared to fixed delta, I am effectively trading smaller and more conservatively with the end result serving to retain profits I already have.
Because of the similar feel, I wonder if this is another form of apples-to-oranges comparison: variable position sizing. This would be a definite no-no in trading system development. Number of contracts remains constant throughout. Max loss per contract remains constant throughout. Only when I looked at capital risk did I see the variability. I would be interested to analyze capital risk over time with fixed delta to compare.
While fixed credit may seem like apples-to-oranges, the pursuit still seems defensible to me. Without question, I want that linear equity curve. If fixing credit generates a linear equity curve then have I cheated by allowing the probabilities to increase over time? Intuitively, I feel a higher PP and concomitant lower credit may mean larger net losses when the market suffers significant corrections. This disadvantage to fixed credit should even the score.
Whether the magnitude (%) of corrections is correlated to underlying price is a different study altogether. I could probably attempt to analyze this but I have a very small number of market corrections to sample. Since the financial crisis, we had the Flash Crash (2010) and the Fiscal Cliff (2011), but then nothing until fall 2014 and the two recent 10% corrections of Sep 2015 and Jan 2016.
In summary, I like what I see with fixed credit but remain uncertain about its validity. While it seems semantically valid (“remains constant throughout“), the effect of the fixed numbers is analogous to variable position sizing and that is what troubles me. Completing the fixed delta backtesting must be done to answer some of these questions.
Categories: System Development | Comments (0) | Permalink