Crude Oil Strategy Mining Study (Part 6)
Posted by Mark on September 10, 2020 at 07:11 | Last modified: September 19, 2020 14:41Today I will wrap up with criticism and conclusions from my latest study on crude oil.
Hypothesis[3] is flawed because it contains a future leak. Only in retrospect will I know how the market moves, but the hypothesis must be defined beforehand. Indeed, whether the hypothesis bears out depends on whether the market goes up/down. I clearly have it backwards.
I think the key to avoiding hindsight bias and future leaks is to put myself in the moment of uncertainty and to figure out how I will make the decision. I can easily look back and say “we were in a bull/bear market,” but in the moment all I have are operational definitions that may or may not be effective. Backtesting will determine this.
This is all to say that while the second sentence in paragraph three of Part 4 is easy to say, in the moment I may or may not be able to deliver. In my testing thus far, I have found all lookback periods to face significant challenges.
Perhaps the harshest criticism of this study is that I may have done the statistical analysis incorrectly. I got a #NUM! error in Excel and e-mailed the plug-in developer. His answer—something he admittedly may have failed to mention—made me question the entire battery of tests. The documentation looks tantamount to an entire statistics course. I will review this before analyzing further to make sure I don’t miss anything else. If necessary, I will revisit this post to correct any mistakes.
I didn’t apply the Holm method and I used alpha = 0.05. Hopefully after studying the documentation, I will have a better answer as to whether the former is necessary and/or whether the latter is too high for multiple comparisons.
Turning my final focus to overall conclusions, while many of the differences I presented are statistically significant, they are close to being wrapped around zero. Most performance numbers average out to be slight losers.
Here are [cumulative] frequency histograms for all 1,632 strategies (i.e. Upper Limit of 1.0 means 0 < PNLDD < 1) :
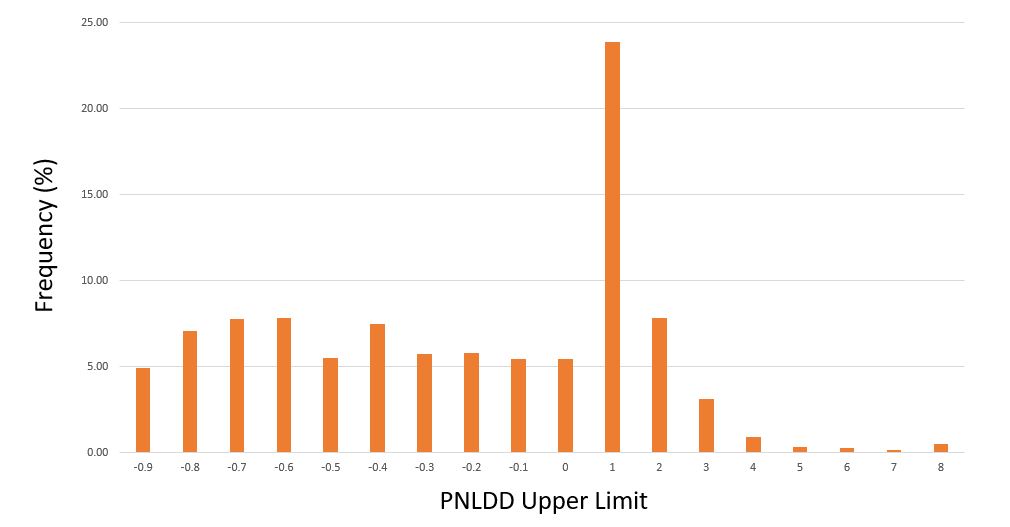
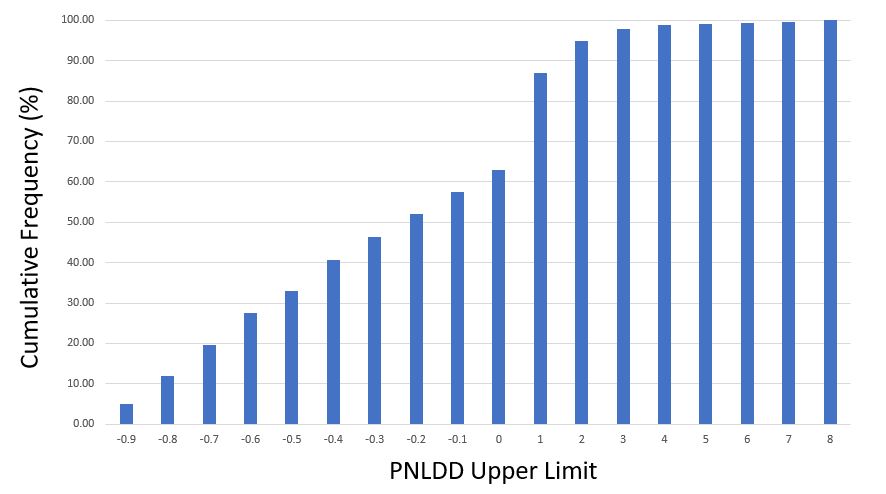
Strategies clock in with dynamite PNLDD numbers (over 2-3)—but it’s only 5% of the total while other strategies are complete meltdowns (see third-to-last paragraph here). I would discard the horrible ones, but this begs the question how the best strategies generally perform going forward. For the next study, perhaps I will shorten up the time intervals and test an OOS3.
This is only my second mining study, but so far I don’t see a whole lot to be excited about. For me, that does not bode well for algorithmic trading.