Testing the Randomized OOS (Part 1)
Posted by Mark on January 27, 2019 at 06:28 | Last modified: June 14, 2020 08:00I previously blogged about validating the Noise Test on my current trading system development platform. Another such stress test is called Randomized OOS (out of sample) and today I begin discussion of a study to validate that.
While many logical ideas in Finance are marketable, I have found most to be unactionable. The process of determining whether a test has predictive value or whether a trading strategy is viable is what I call validation. If I cannot validate Randomized OOS then I don’t want to waste my time using it as part of my screening process.
The software developers have taught us a bit about the Randomized OOS in a training video. Here’s what they have to say:
- Perhaps our strategy passed the OOS portion because the OOS market environment was favorable for our strategy.
- This test randomly chunks together data until the total amount reaches the specified percentage designated for OOS.
- The strategy is then retested on the new in-sample (IS) and OOS periods to generate a simulated equity curve.
- The previous step is repeated 1,000 times.
- Note where the original backtested equity curve is positioned within the distribution [my dependent variable (DV) #1].
- Watch for cases where all OOS results are profitable [my DV #2]; this should foster more confidence that the original OOS period is truly profitable because no matter how the periods are scrambled, OOS performance will likely be positive.
I want to further explain the second bullet point. Suppose I want 40% of the data to be reserved for OOS testing. The 40% can come at the beginning or at the end. The 40% can be in the middle. I can have 20% at the beginning and 20% at the end. I can space out 10% four times intermittently throughout. I can theoretically permute the data an infinite number of times to come up with different sequences, which is how I get distributions of simulated IS and OOS equity curves.
Here are a couple examples from the software developers with the left and right graphs being IS and OOS, respectively, and the bold, blue line as the original backtested equity curve:
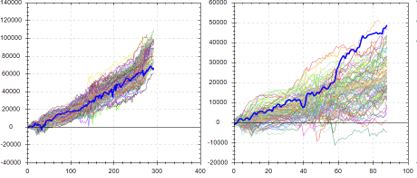
This suggests the backtested OOS performance is about as good as it could possibly be. Were the data ordered any other way, performance of the strategy would likely be worse: an ominous implication.
Contrast to this example:
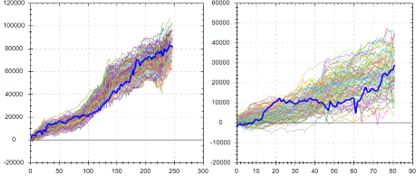
Here, backtested OOS performance falls in the middle (rather than top) of the simulated distribution. This suggests backtested OOS performance is “fair” because ~50% of the data permutations have it better while ~50% have it worse. This is considered more repeatable or robust. In the previous example, ~100% of the data permutations gave rise to worse performance.
The third possibility locates the original equity curve near the bottom of the simulated distribution.* This would occur in a case where the original OOS period is extremely unfavorable for the strategy—perhaps due to improbable bad luck. Discarding the strategy for performance reasons alone may not be the best choice in this instance.
I will continue next time.
* — I am less likely to see this because the first thing I typically do is look at
IS + OOS equity curves and readily discard those that don’t look good.