Profit with Implied Volatility (Part I)
Posted by Mark on March 29, 2012 at 13:43 | Last modified: March 29, 2012 13:43At the most, “option trading” and “volatility trading” are synonymous terms. At the least, you cannot have a complete understanding of option trading without knowledge of implied volatility. Since I can’t go too far in my discussion of options without covering this topic, I will begin today. What follows in these posts will serve as a primer on implied volatility (IV).
I hesitate to use the S-word here, but a relatively simple interpretation of IV is how expensive an option is. If you go to the grocery store every week and look at apples then you will develop a good sense of price in terms of range and frequency.
Consider a shopper’s hypothetical experience. Suppose the most (least) expensive price he has ever seen for a bag of apples is $3.99 ($1.99) and usually he can buy them for around $2.69. Today’s price happens to be $4.39.
Whether our shopper will buy apples today depends on necessity and/or market outlook. If he absolutely must have the apples now (i.e. stop-loss) then he will pay regardless of price. If apples are not a necessity (i.e. opening a trade) then market outlook will be his deciding factor. If he thinks today’s price is a temporary blip and normal prices will be seen again soon (i.e. trading range) then he will not buy. If he thinks price is just beginning to explode higher (i.e. breakout) then $4.39 is probably a bargain compared to what they will cost in the near future and he probably will make the purchase.
Like stocks, supply and demand is what ultimately drives IV. The more an option is being bought (sold), the higher (lower) its IV will be.
Tags: trader education | Categories: Option Trading | Comments (2) | PermalinkThe Naked Put (Part IV)
Posted by Mark on March 27, 2012 at 08:35 | Last modified: March 29, 2012 13:57In my last post on 3/25/12 (http://www.optionfanatic.com/2012/03/25/the-naked-put-part-iii/), I continued analysis of an AAPL 510 naked put income trade. I concluded the max risk on this trade to be $102,000 if overlapping trades both take assignment, but this is highly unlikely for a couple reasons.
First, AAPL stock would have to drop over 15% to reach $510/share. AAPL stock has not dropped this precipitously in years. This is over 90 points, which would be nine times the daily average true range of the stock over the past 15 days.
Second, the conditions by which assignment is most favorable are not present at this time. Assignment most commonly occurs just before a dividend is issued or near option expiration when virtually all time value has decayed from an option (hold that thought for a later blog post). With 33 days to option expiration, in order for our 510 put to be at risk for assignment and lose most of its time premium, AAPL stock would have to fall at least 30%.
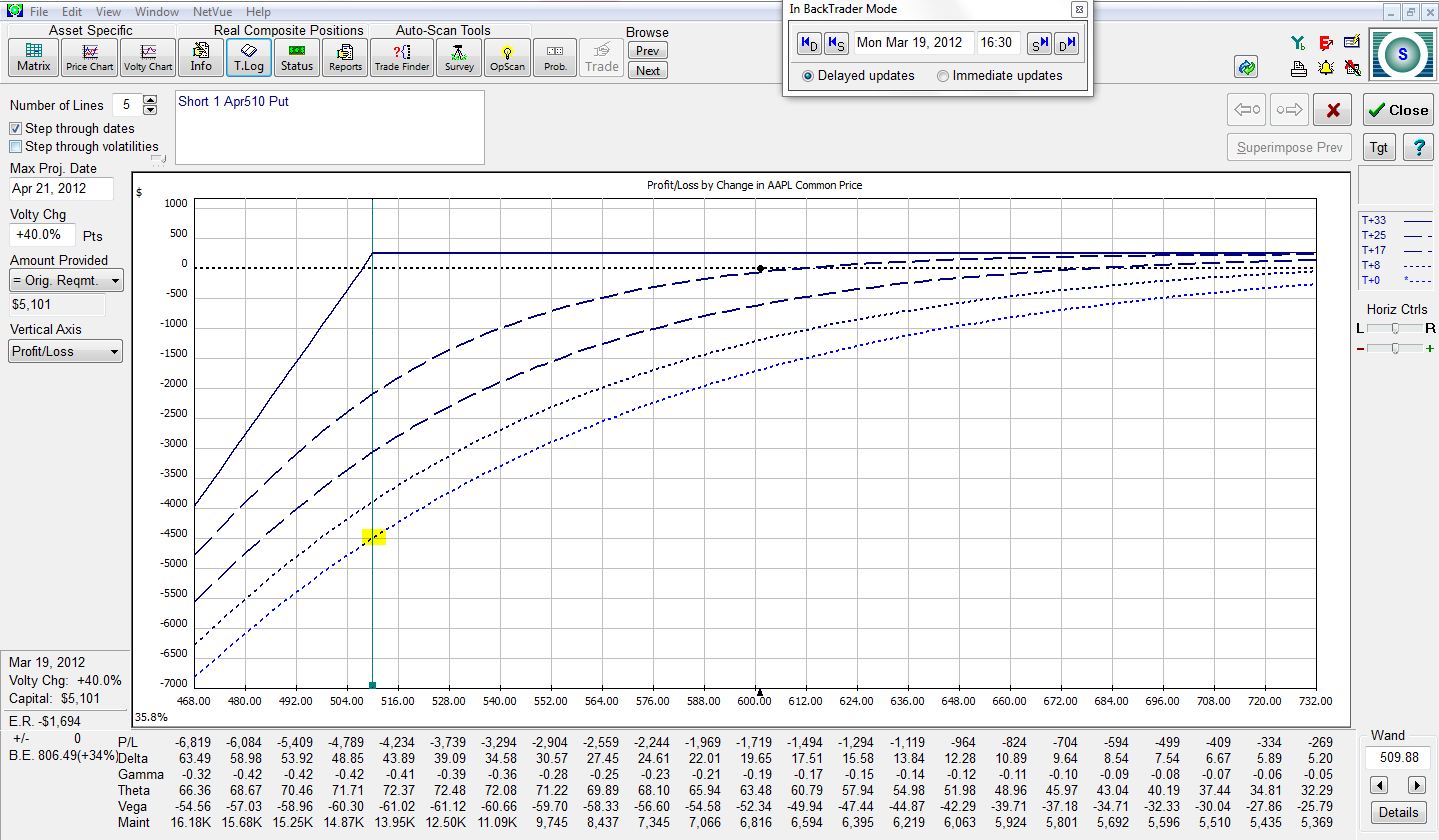
Suppose AAPL stock fell to the strike price of $510 on Trade Day #1. The risk graph would look like this:
The trade is now down $4,500. That’s much less than the max risk we calculated of $51,000 for one trade. The more time it takes for AAPL to fall to 510, the less this loss would be. This is diagrammed by moving step-by-step up the series of dotted lines.
In order to lose more than $4,500 on this trade, AAPL would have to fall below $510. The longer we are in the trade, the farther below $510 AAPL would have to fall. I’ll fudge this a bit to account for slippage and say the max loss would be $6,000 rather than $4,500.
For all practical purposes, then, if we enter a contingent order to exit this trade when AAPL hits $510, the max risk would be $6,000. Even if we had overlapping positions, this total is $12,000. The monthly return on this trade is now $240 / $12,000 = 2%. The annual return could be 24%.
The question to always ask is, “would there ever be a case where I would need more than $12,000 to hold this position?” I believe the answer to this question is yes. I will continue with the analysis in future posts.
Tags: income trading, risk management, trader education | Categories: Option Trading | Comments (0) | PermalinkThe Naked Put (Part III)
Posted by Mark on March 25, 2012 at 12:12 | Last modified: March 29, 2012 13:56Option income trading purports to generate consistent profits on a daily basis. As defined in my post on March 20 (http://www.optionfanatic.com/2012/03/20/the-naked-put-part-i/), an option income trade is a positive theta position. The exemplar I have been studying is an April 510 naked put on AAPL (see http://www.optionfanatic.com/2012/03/22/the-naked-put-part-ii/). The profit potential for this trade is $240/contract.
To better understand this trade, we need to know the risk. If AAPL sinks below $510 then the naked put could be assigned. The max risk of this trade is therefore $510/share * 100 shares = $51,000. While your stock would most probably have significant market value, in the worst-case scenario with AAPL stock crashing to zero, you would be out $51,000. The max potential return on this trade is therefore $240 / $51,000 = 0.47%.
Repeating this sort of trade every month would roughly generate an annualized return of 0.47% * 12 = 5.6%, right? Not exactly. With the trade being placed with 33 days to expiration, the possibility is great for two overlapping positions to be on at once. The max risk therefore has to be 2 * $51,000 or $102,000. This now yields a max annualized return of 2.8%.
While 2.8% is a very small return, realize how conservative this trade is. AAPL would have to fall 15% within 33 days in order for the profit not to be made on this trade. If you look back on a price chart, you’ll find it has been years since AAPL has fallen 15% in 33 days. Anything is possible, but because this would be such a rarity, many market observers would consider this trade to be reliable like an ATM machine.
Is this an accurate portrayal? I’ll cover some further insights in my next post.
Tags: critical thinking, income trading, trader education | Categories: Option Trading | Comments (3) | PermalinkThe Naked Put (Part II)
Posted by Mark on March 22, 2012 at 10:53 | Last modified: March 29, 2012 13:56The holy grail of trading could be achieved through booking consistent profit on a daily basis. In my last post on March 20 (http://www.optionfanatic.com/2012/03/20/the-naked-put-part-i/), I described an April 510 naked put trade on AAPL. Today, I want to illustrate that trade by presenting a series of risk graphs.
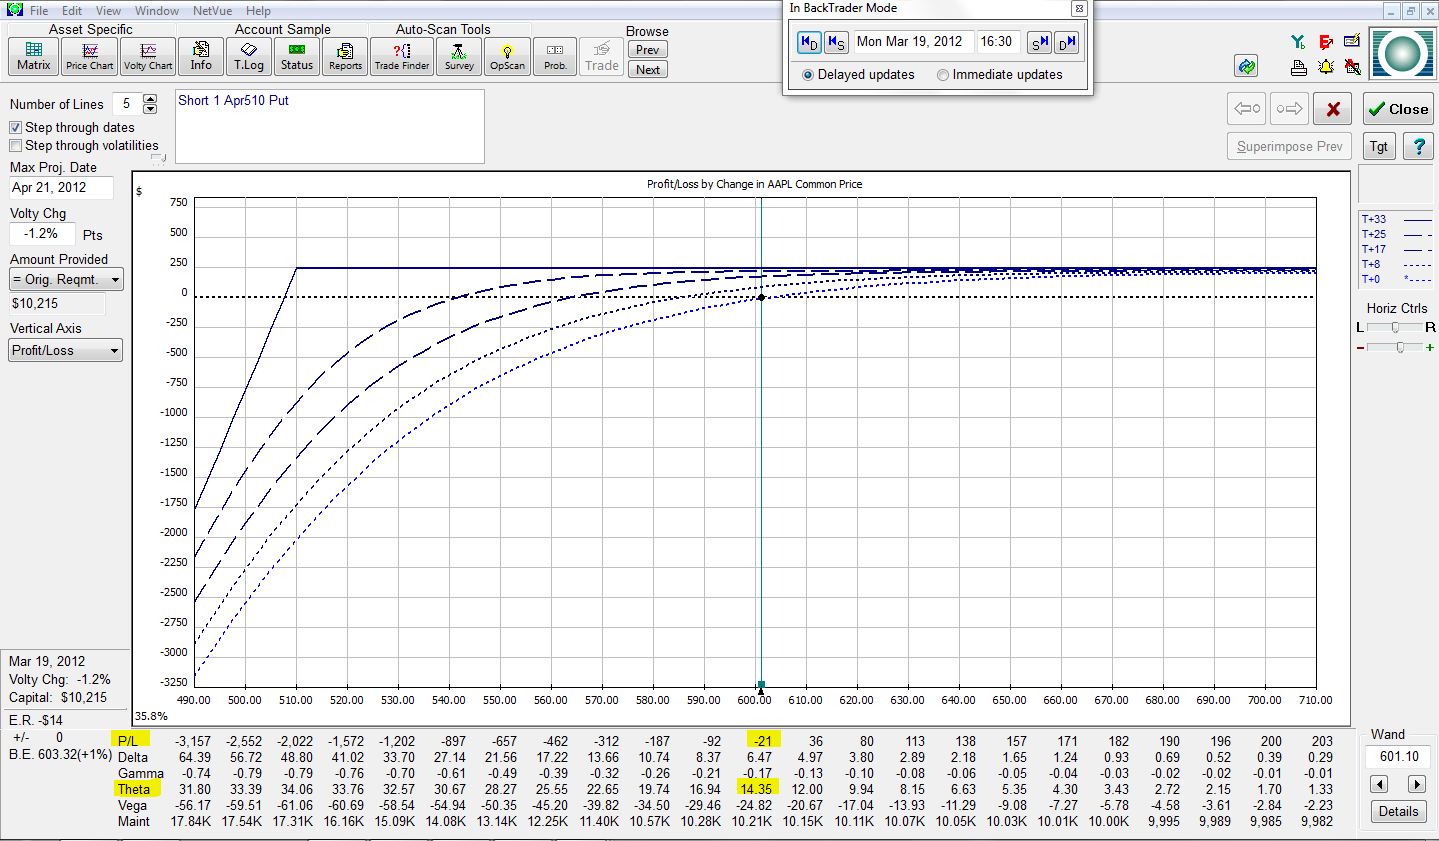
As mentioned, the trade was placed on March 19, with 33 days to April options expiration. At trade inception, the trade looks like this:
The green vertical line is the “wand,” which now sits at AAPL’s current price of 601.10. For the purposes of this analysis, I will assume stock price and volatility (to be described at a later date) always remain constant. The risk graph shows the P/L of the position (y-axis) based on the price of AAPL stock (x-axis). At trade inception, focus on the T+0 curve, which is the lowest dotted curve (also differentiated by a lighter blue color). The yellow highlighting indicates the trade to be currently losing $21 due to transaction costs and to have a theta value of 14.35. The trade will make $14.35/day.
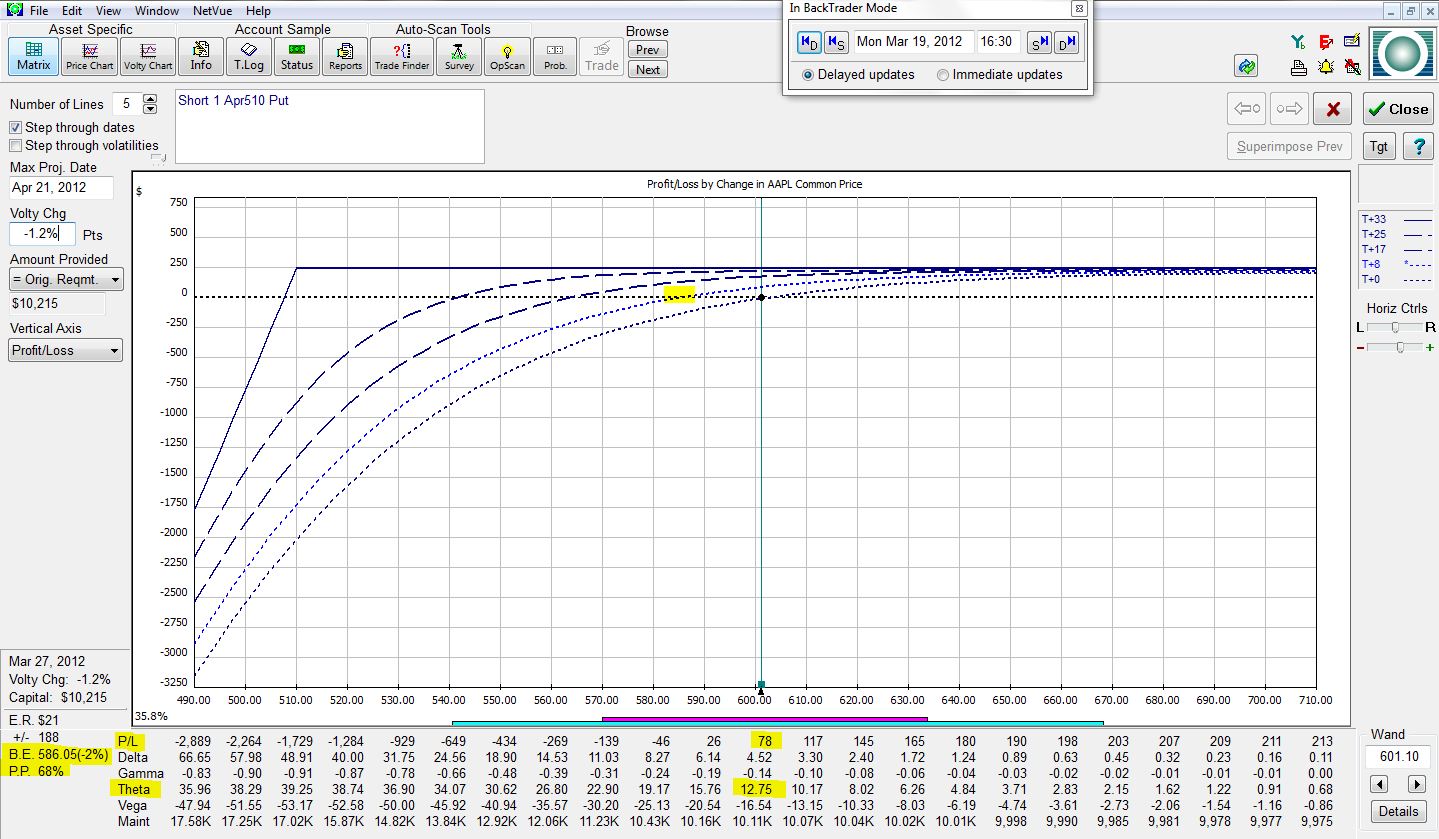
Let’s now fast forward to the next-higher dotted curve, which represents the position eight days into the future:
The P/L is +$78 with a theta value of 12.75. The trade will now make $12.75 per day. The yellow highlighted portion on the dotted curve corresponds with the “B.E.” in the lower left of the risk graph. This shows how far the stock would have to fall (2%) for the trade to be at breakeven (P/L = $0). P.P. is “probability of profit.” Eight days into the future, the risk graph shows this trade to have a 68% chance of being profitable.
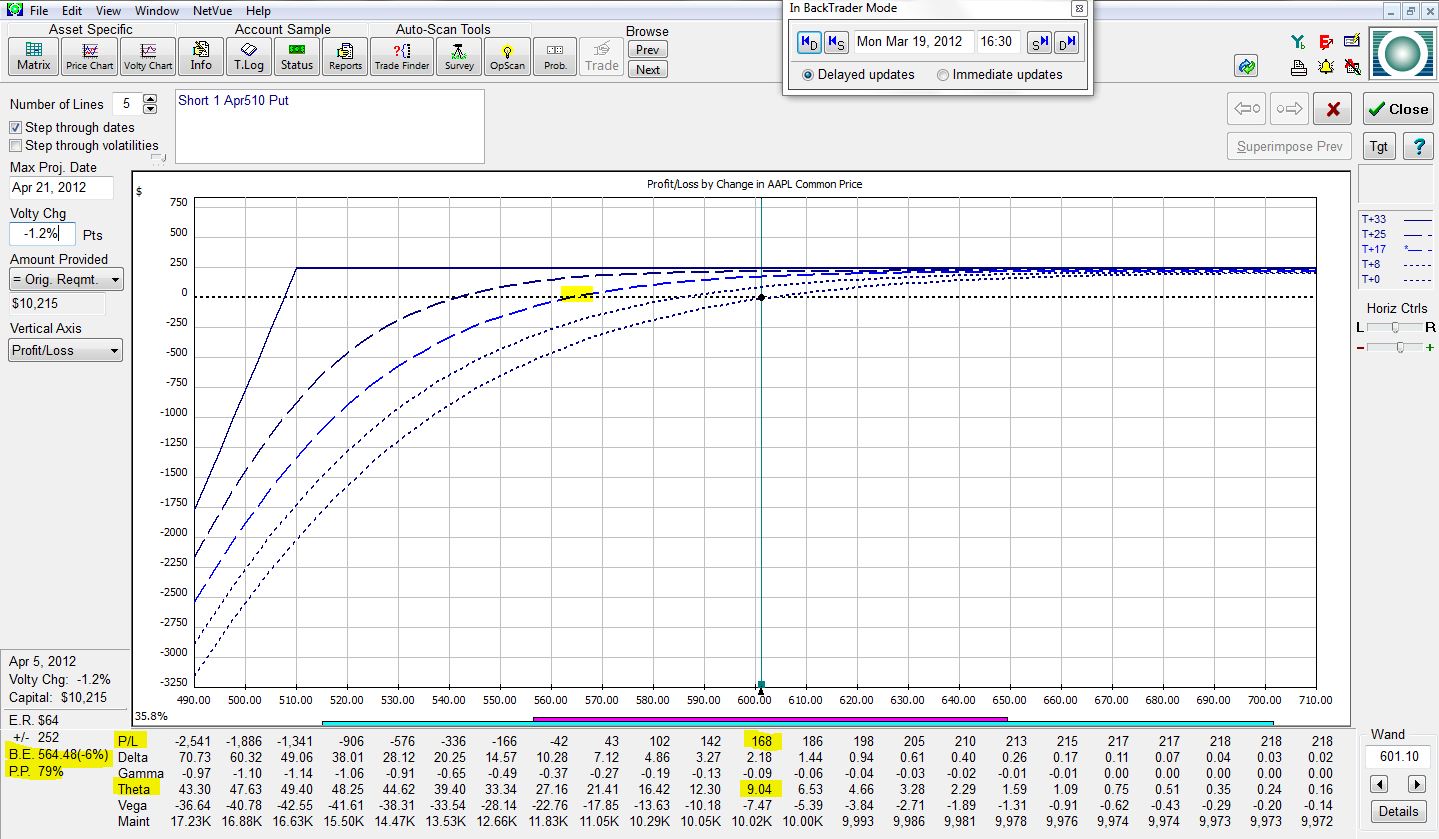
Next, let’s jump nine more days into the future:
The P/L is now +$168 with a theta value of 9.04. The B.E. is 6% below the current market price, which means AAPL stock could drop up to 6% before the profit on this trade evaporates. The trade would have a 79% chance of showing a profit.
Moving eight days further ahead:
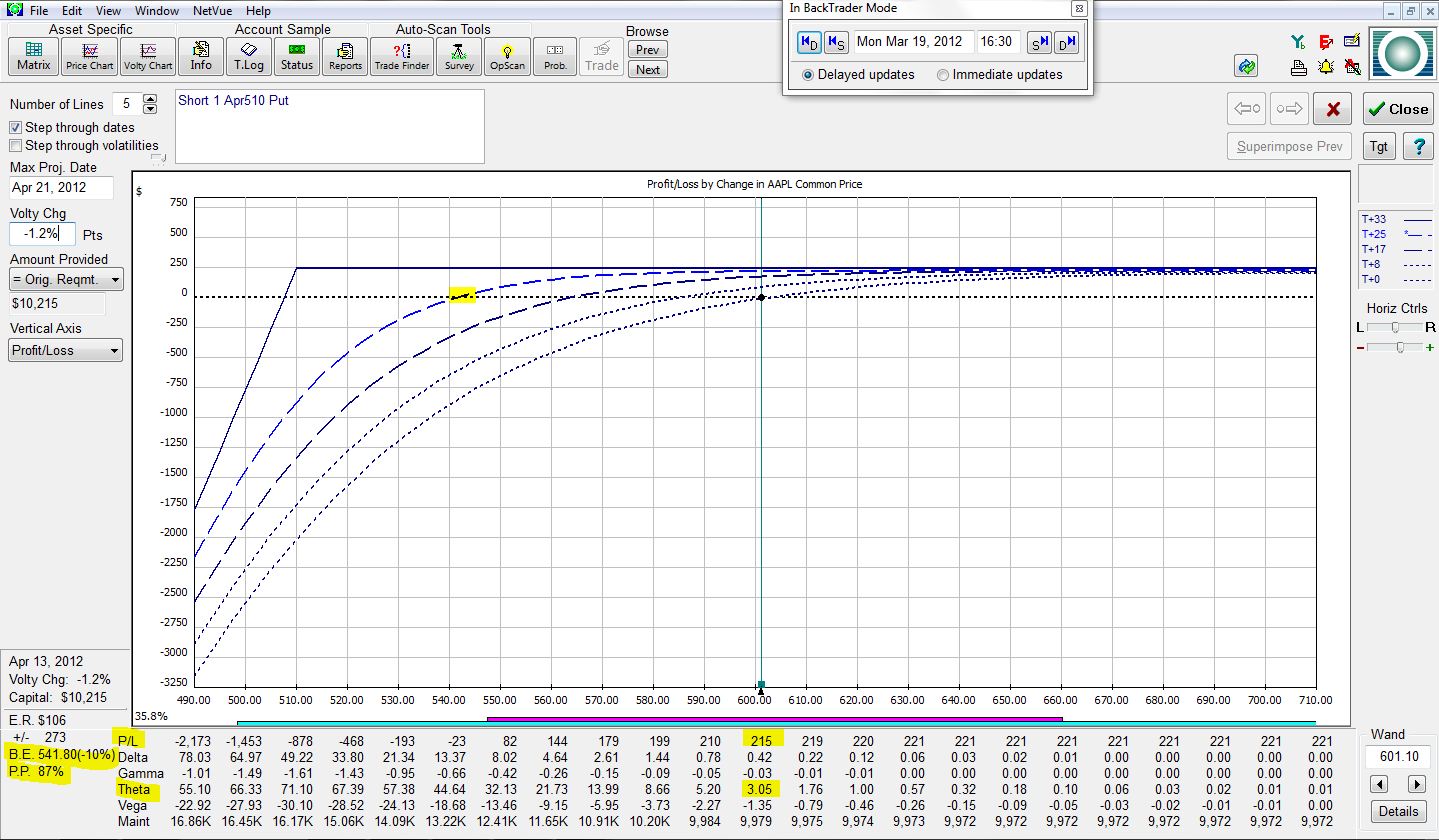
The trade is now up $215 with a theta value of 3.05. AAPL stock could fall up to 10% without this trade showing a loss. The probability of this trade being profitable after 25 days is 87%.
Finally, the risk graph at expiration (eight more days into the future or 33 total days from trade inception) is:
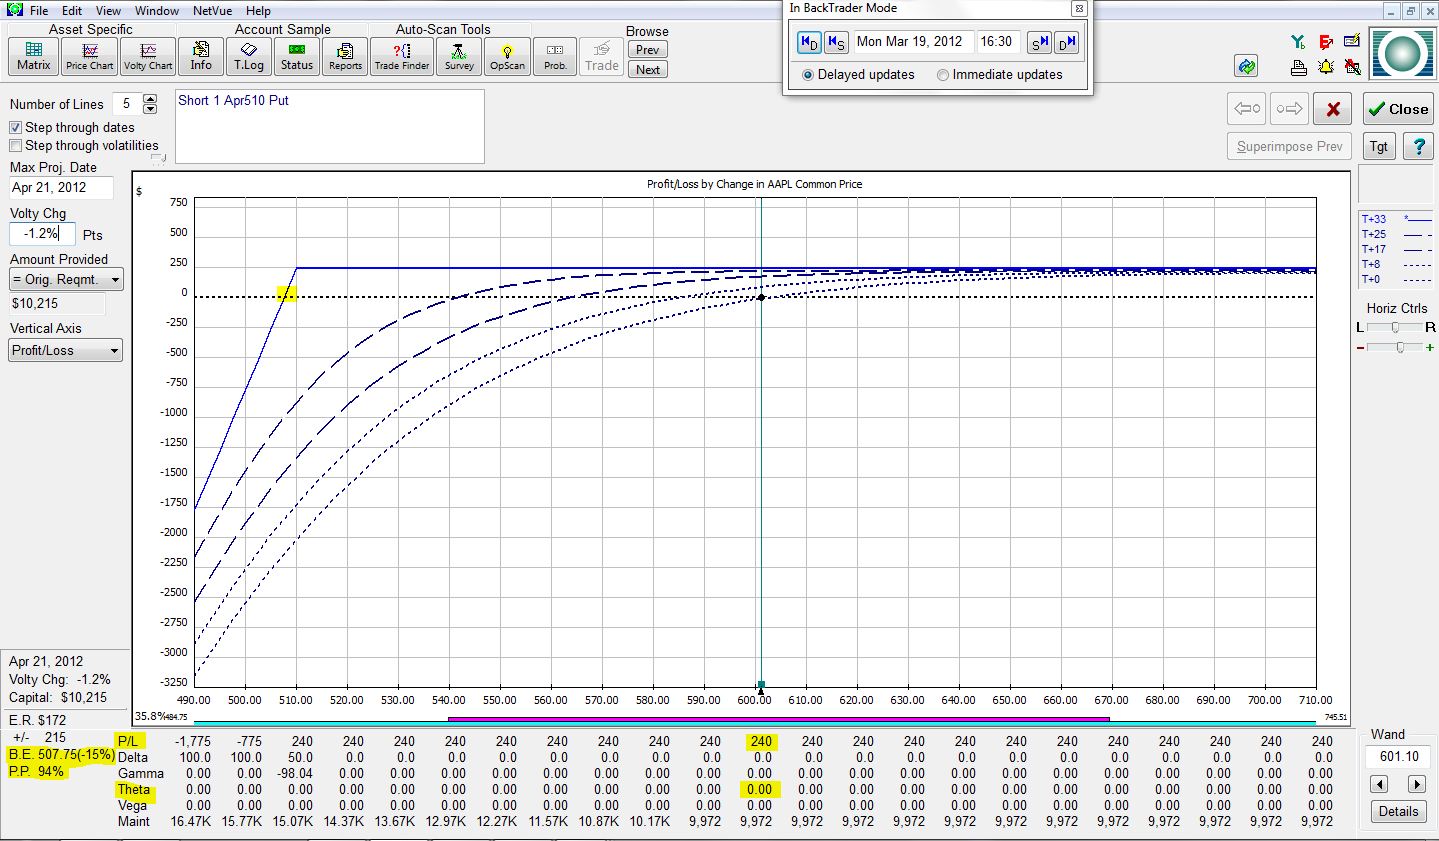
The trade has made the full $240. Theta is now zero since the option has expired. The trade has 15% of downside stock protection and a 94% chance of posting a profit.
Note how theta decreases over time as more and more of the available profit has been made on the trade. In my next post, I will discuss some implications of this observation and go into more detail about the trade.
Tags: income trading, trader education | Categories: Option Trading | Comments (2) | PermalinkThe Naked Put (Part I)
Posted by Mark on March 20, 2012 at 08:08 | Last modified: March 28, 2012 07:43In the quest for consistent trading profits, I have turned to option income trading: the establishment of a positive theta position. Theta is an “option greek” that describes what will happen to your P/L as each day passes. When you establish a positive theta position, you can expect to make daily money from time decay.
In theory, this is best understood by assuming no change in stock price from now until expiration. On March 19, AAPL stock closed at $601.10. I can sell an April 510 put for about $2.40. If AAPL remains at $601 then with the passage of each day, I stand to make about $14. When the option expires worthless in 33 days, the entire $240 will be mine.
Of course, no free lunch exists with option trading [or anything else?]. In exchange for the $14/day, I have taken on the obligation to buy 100 shares of AAPL for $510/share (the “strike price”) on or before April 21. As long as AAPL remains above the strike price, nobody in their right mind would have me buy their shares for $510 each because they could sell on the open market for a higher price. This is why the 510 put would expire worthless.
As with all aspects of trading and investing, option income trading is paired with risk. In future posts, I’ll talk more about this risk, volatility, and different aspects of option trading that I am fanatical about.
Tags: income trading, trader education | Categories: Option Trading | Comments (4) | PermalinkTo Optimize or Not to Optimize?
Posted by Mark on March 15, 2012 at 11:44 | Last modified: March 15, 2012 11:54In the quest for consistent trading profits, backtesting is generally regarded as useful but optimization is viewed by some as a four-letter word.
If a system captures profits from consistent human behavioral characteristics reflected in the market then the past should reasonably approximate the future. This will never be perfect but it may be profitable.
Optimization is the determination of what trading parameters applied to past market action would have resulted in maximal returns. After all, if it worked well in the past then shouldn’t be likely to work in the future if the past is at least some small reflection of the future due to those consistent behavioral characteristics? This is called curve-fitting.
One of the biggest scams on Wall Street is to present a system with brilliant historical returns (anyone can run an optimization procedure on backtested data to do this) and sell it as a system to be used in live trading. Trading an optimized system into the future is almost guaranteed to underperform the past. Selling an optimized system can be like selling snake oil, and charlatans abound in financial circles who aim to do just that.
To avoid excessive curve-fitting, some think that if you don’t optimize then you can’t fall prey to the illusion. Choose only one parameter value and backtest it; if you come up with impressive results then they’re likely to persist into the future, right?
Not necessarily!
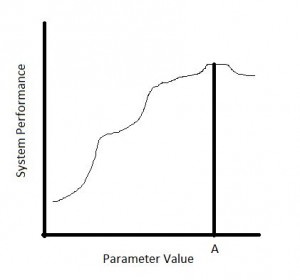
Suppose a system has one parameter (e.g. period for a moving average). Imagine backtesting the system repeatedly over the historical time period while changing the period each time. When you plot performance, does it look like this…
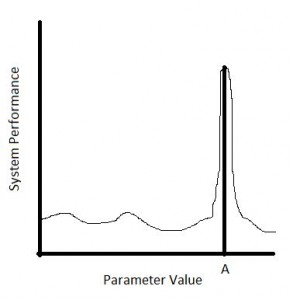
…or like this?
In both cases, using a period of A would have resulted in the best historical performance. However, in the latter case, if the period varied just a tad higher or lower then system performance was devastated. In the former case, trading with a period higher or lower than A would still have generated solid performance. Since the past is never identical to the future, which do you think has a better chance of generating profits going forward?
The bottom line is that “curve-fitting” and “optimization” are not four-letter words if used to know what you do not know. Optimize not with the intent of finding the perfect parameter to trade going forward. Optimize with the intent to determine whether encouraging past results are likely to persist into the future.
Tags: critical thinking, survival, trader education | Categories: System Development | Comments (0) | Permalink
Prevent Huge Portfolio Losses
Posted by Mark on March 14, 2012 at 13:07 | Last modified: March 20, 2012 08:28One key to success in trading and investing is to prevent huge portfolio losses. If you lose 50% of your portfolio, for example, then you have to gain 100% just to get back to even. Off the top of my head, I can think of three ways to limit huge portfolio losses:
1. Diversify
What this really means is to include uncorrelated assets in your portfolio. “Uncorrelated” means prices tend not to move in sync. For example, if one goes up, the other goes sideways or down. Alternatively, if one goes way down then the other goes up, sideways, or down a little.
The danger of diversification is that in extreme circumstances correlation can go to 1, which means everything moves together. You could be invested in markets that had historically been uncorrelated but when the crash hits, everything goes down. We saw this in fall 2008 when gold, bonds, and the stock markets all fell precipitously for a while.
2. Position size to limit total exposure.
If you are only 10% invested then the most you could ever lose if that asset (e.g. stock) goes to zero is 10%. The remaining 90% of your portfolio would be in cash.
3. Buy puts
Put options profit when their underlying markets fall. Options were originally created to serve as insurance and this is exactly what long puts can do.
Other ways of achieving this goal are to short markets or to buy inverse ETFs.
Tags: survival | Categories: Money Management, Option Trading | Comments (0) | PermalinkCurtis Faith on Accountability
Posted by Mark on March 11, 2012 at 06:46 | Last modified: March 10, 2012 08:28As mentioned yesterday in my post “Words to Profit By” (http://www.optionfanatic.com/2012/03/10/words-to-profit-by/), just because this may sound good does not make it relevant. Give it some thought to see if it might apply to you:
“The idea that Rich had left out some key ideas was the easiest way for our paranoid Turtle to explain his inability to trade successfully during the program. This is a common problem in trading and in life. Many people blame their failure on others or on circumstances outside their control. They fail and then blame everyone but themselves. Inability to take responsibility for one’s own actions and their consequences is probably the single most significant factor leading to failure…
Trading is a good way to break that habit. In the end, it is only you and the markets. You cannot hide from the markets. If you trade well, over the long run you will see good results. If you trade poorly, over the long run you will lose money…
The bottom line is that you make the trades and you are responsible for the outcome. Don’t blame anyone else for giving you bad advice or withholding secrets from you. If you screw up and do something stupid, learn from that mistake, don’t pretend you didn’t make it. Then go figure out a way to avoid making that same mistake in the future…
Blaming others for your mistakes is a sure way to lose.”
–From Way of the Turtle (McGraw-Hill, 2007)
Tags: critical thinking | Categories: Accountability, Wisdom | Comments (0) | PermalinkWords to Profit By
Posted by Mark on March 10, 2012 at 08:13 | Last modified: March 10, 2012 08:13With today’s post, I am going to introduce a new category: “Wisdom.” I do a lot of reading and occasionally I come across a quote or passage that really rings true with me or seems to be of great significance.
Just because something sounds good does not mean it has any necessary relevance at all. This is my grand disclaimer. Some people make a habit of collecting “great quotes,” posting them, and including them in e-mail signatures. Some people think just reflecting these “great quotes” makes them look all educated and brilliant. I believe what makes you brilliant is not the “great quotes” themselves but critical evaluation to determine whether they can be applied to you or anyone else.
This echoes an interesting concept in the world of trading systems. Upon first glance, many ideas for trading systems make good technical or fundamental sense. When you backtest them, though, you’ll find their performance to be in the toilet.
Just because something sounds good does not mean it is actionable or will lead to consistent profitability. We need to differentiate between the two in order to be successful traders.
Tags: critical thinking | Categories: Wisdom | Comments (2) | PermalinkHow to Learn Trading’s Best Kept Secret
Posted by Mark on March 8, 2012 at 08:56 | Last modified: March 8, 2012 08:58Consistent profits through trading may be facilitated by a good piece of [backtesting] software. Last week, I posted about a free on-line trading group I’m trying to form targeted toward learning the basics of AmiBroker (please see http://www.optionfanatic.com/2012/03/01/tradings-best-kept-secret/ ).
I feel strongly about participation with this group. Except for the programmers and people with a heavy quant background, you’re not going to learn AmiBroker (AB) by casually opening the program once or twice a week and fiddling around for 10-15 minutes at a time (I speak from unfortunate experience). Going forward, what I really want to do is take some time every single trading day to work with AB. I’m better able to do this alongside others seeking to achieve similar goals.
I expect those of us in the group to post regularly and to really make it clear that we are doing the work to learn the program, develop our skills, and become better system developers and/or traders.
I don’t think it necessary to be a full-time trader to make this commitment. If you have a day job, kids, and family, then I understand life can get quite busy. I do believe that if you’re going to learn AB then you need to set aside some time on a very regular basis. If you can’t do that then perhaps something more user-friendly like Metastock or TC2000 would be a better fit.
Lurkers can hang out in the AmiBroker User’s List where plenty of experts already contribute their time at a level far too advanced for most newbies.
Lurking is not the way to proficiency. I don’t want lurkers in the beginners’ group.
Tags: AmiBroker | Categories: Accountability, Trading Software | Comments (0) | Permalink