Quality and Fundamentals (Part 4)
Posted by Mark on July 8, 2025 at 07:31 | Last modified: February 8, 2026 12:17In Part 3, I revised the overriding question for this mini-series from whether quality and/or fundamentals are important for stock analysis and what the difference may be to what matters most for the stock study [guide, or SSG]?
Once answered, I can address the limitations of the SSG methodology itself. One thing I know already is that the methodology is not well-suited to stocks failing visual inspection.
Let’s go back to something else mentioned in Part 3: earnings predictability. This is one component to the Manifest Investing Quality rating. Value Line also gives an earnings predictability score for stocks covered in its Standard Edition. I have come to see earnings predictability as related to 5- and 10-year R^2 metrics.
The latter point suggests earnings predictabilty really caters to “up, straight, and parallel.” Financial wisdom dictates past performance does not guarantee future results but visual inspection says if a company has not been consistent (linear) in the past then we’re not giving it a chance to disappoint in the future. Only companies that have been consistent growers in the past are legitimate candidates for stock selection. This seems intuitive enough but does it really hold water?
The following bar chart from Google AI gets me concerned:
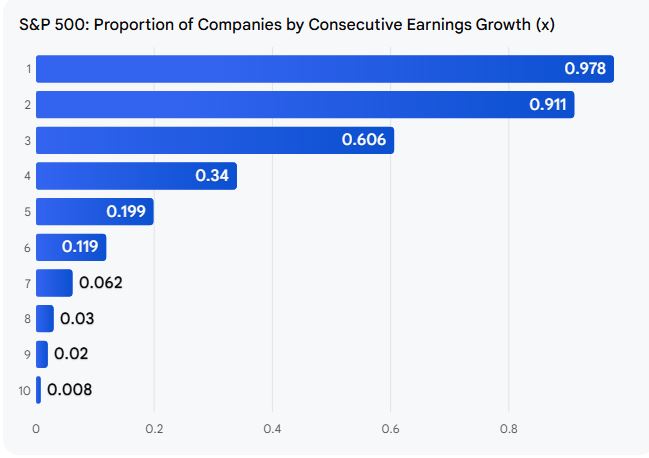
The number on the left (y-axis) is consecutive years of earnings growth. The chart shows that number inversely proportional to number (percentage) of S&P 500 companies. It therefore seems likely that the more consistent a company has been, the more likely it is to falter: the last thing we want because earnings decline often takes stock price with it.
The next big question is whether a faltering company is more likely to find its footing given a historical track record of consistent earnings growth. Once again, Google AI:
> Based on historical S&P 500 data, a company with a history of consistent
> earnings growth is slightly more likely to return to a path of consistent
> growth after an annual loss compared to companies without such a history.
> Specifically, companies with consistent past growth had a 58.3% probability
> of returning to consistent growth following a loss incident, while those
> without a consistent history had a 54.5% probability.
I am a bit skeptical for a few reasons. First, I don’t know if “history of consistent earnings growth” matches my concept. Also, it was unable to give me sample sizes for the 58.3% and 54.5% [I was hoping] nor was it able to give me a p-value on the difference [I did not expect]. Not seeing a larger difference may somewhat call into question the concept of quality management: a team with the secret sauce able to maintain the earnings consistency we seek. Certainly we wouldn’t want to be cherry-picking companies benefiting from random chance.
I will continue next time.
————————
A 90-day free trial to BetterInvesting® may be secured here (also see link under “Pages” section at top right of this page).