HSA Strategy (Part 5)
Posted by Mark on September 5, 2025 at 07:00 | Last modified: March 5, 2026 09:18In Part 4, I discussed some different approaches to managing [investment] funds in Health Savings Accounts (HSA). I conclude today by addressing one other question: should the HSA be approached as a portfolio in and of itself or may it be used as one segment of the total portfolio?
Please see the second paragraph of Part 4 for the full disclaimer.
If I’m going to invest a segment of my overall portfolio to invest in individual stocks, then perhaps I want to do that in my HSA where the Triple Tax Advantage (see numbered list) provides most value. This would be great unless one of the stocks ends up a BetterInvesting® “Rule of Five” loser (see The 80% Rule”) thereby sapping the HSA forevermore since contributions are limited. Of course, it could be a “Rule of Five” winner and the latter [uncapped] potential benefit outweighs the former risk.
Treating the HSA as its own diversified portfolio can eliminate the risk of catastrophic loss but I see several disadvantages.
The first disadvantage, as alluded to above, is inefficient asset location. Maximize HSA tax-free compounding by allocating to high-growth equities and move low-growth assets (e.g. bonds) to a Traditional IRA or 401(k) where growth eventually gets taxed as ordinary income.
A second disadvantage is potential fatigue due to management complexity. If aiming to maintain a particular 60/40 or 70/30 equity/bonds split, then manual rebalancing trades will have to be done periodically for what is probably an individual’s smallest account. For those living in CA or NJ where the HSA’s tax-exempt status is not recognized, things get worse because rebalancing can trigger state capital gains taxes. Every dividend must also be tracked for state tax reporting.
A third disadvantage results from many HSA providers offering limited investment options. Many providers also require keeping at least $1,000–$2,000 cash in the account to invest [although a diversified portfolio may include this anyway].
Treating the HSA as a separate portfolio also makes it harder to monitor overall risk exposure. Being conservative in an HSA but aggressive in a 401(k) may result in an overall allocation that doesn’t actually match one’s risk appetite.
Inflation risk is a fifth potential disadvantage: returns on cash and/or bonds not outpacing rising medical costs.
In summary, treating an HSA as a standalone portfolio creates tax friction and management complexity that can erode long-term wealth. The better option seems to be inclusion with the high-growth segment of an overall diversified portfolio.
Categories: Accountability | Comments (0) | PermalinkHSA Strategy (Part 4)
Posted by Mark on August 25, 2025 at 07:12 | Last modified: March 1, 2026 10:49In the last three posts, I have been definining and explaining Health Savings Accounts (HSA). Now let’s consider management.
Please remember this is not professional advice and not intended to replace the services of a tax advisor or attorney. HSA contributions, distributions, and eligibility are IRS-governed and subject to change. As the account holder, you are responsible for verifying eligibility, tracking transactions, and complying with IRS regulations. While some HSA funds are FDIC-insured, investment options are not bank-guaranteed and may lose value. Information provided here is [mostly] accurate at time of writing but subject to change based on new legislation or IRS guidance.
I have already opened an HSA with Fidelity because I deem that a reputable brokerage very diverse in terms of what types of investments are allowed. Next, I need to fund and invest.
A conservative management approach would be to use the HSA to pay for doctor visits and prescriptions throughout the year while maintaining enough cash to cover the annual HDHP deductible or out-of-pocket maximum. Being forced to sell investments during a market downturn to pay for medical emergency is thus circumvented.
A more aggressive approach would be to invest the HSA aggressively (100% in equities) with the intention of letting it grow tax-free for many years. This applies to those with outside funds to cover any immediate medical needs. In essence, the HSA then becomes a Roth IRA on steroids: tax-deductible contributions and tax-free growth. Examples of allocation include Vanguard Total Stock Market (VTI) or Fidelity Total Market Fund (FZROX), large-cap S&P 500 (VOO or SPY), or higher-risk growth funds like Nasdaq-100 (QQQM or QQQ) or Fidelity Semiconductor (FSELX). The latter is of particular interest because tax-free growth on high-returning assets can be priceless.
To minimize needless charges, research expense / tax-cost ratios and choose the lowest between equivalent funds. In today’s competitive environment, mutual funds should definitely be of the no-load variety.
A hybrid option would be to leave $1,000 – $3,000 in cash (or a money market fund) for emergencies with anything more invested in equities. Once again if discretionary income [for non-essentials] is available, then the bills could be paid from elsewhere and reimbursed (withdrawn) from the HSA at any future point.
An issue I often debate is whether it is okay to invest aggressively in tax-advantaged accounts given the increased risk of loss. On one hand, aggressive investment can squeeze maximum value out of tax-advantaged status. On another hand, losses in tax-advantaged accounts cannot be used to offset other gains. This begs for the standard recommendation to invest aggressively in proportion to time remaining until retirement to allow portfolio recovery in case of market downturn.
Should the HSA be treated as a separate portfolio, though, or as one segment of total net worth? I will resume here next time.
Categories: Accountability | Comments (0) | PermalinkHSA Strategy (Part 3)
Posted by Mark on August 22, 2025 at 07:07 | Last modified: February 27, 2026 09:59Today I plan to wind up discussion of Health Savings Accounts (HSA) prior to deliberation over how to manage my own. Please remember this is for educational purposes only.
I see several good reasons to have an HSA for those fitting the suitability profile described in the fifth paragraph here. HSAs allow for delayed reimbursement: pay now, save the receipts, and reimburse oneself in the future thereby allowing more time for tax-free growth. Although contributions are out-of-pocket funds that could otherwise be used elsewhere, the bulleted list here for what does qualify is extensive. Odds are one will find plenty on which to spend HSA funds unless precluded by sudden death at a relatively young age.
Most HSA providers allow investment in stocks, mutual funds, or ETFs once a minimum threshold (ranging from $2,000 down to $0) is reached.
A final benefit to having an HSA is its function as a retirement hedge. Flexible spending accounts [owned by employer] carry “use-it-or-lose-it” [most commonly by year-end or final day of employment] risk. HSA funds belong to the individual, never expire, will roll over at year-end, and will remain after job change or retirement. HSAs also have a built-in safety net should one reach retirement with a large balance: opportunity to use the funds for non-qualified healthcare expenses while still being taxed like a traditional IRA (advantaged at tax-deferred just not as advantageous as tax-free). Another retirement hedge is the triple tax advantage (see numbered list) making HSAs widely considered to be the most tax-efficient retirement vehicle available in the United States. Finally, HSAs hedge against outliving other retirement assets by having no required minimum distributions (and tax-free passage after death to surviving spouse).
In thinking about the HSA as a tool to cover personal health expenses forevermore, I wondered how big an HSA could possibly get or how much they are worth on average.
Per GoogleAI, the average HSA balance rose to approximately $3,997 by mid-2025 with total HSA assets reaching ~$159 billion across 40 million accounts. Specific providers like Lively report higher average balances of $5,457 (up 11% YOY) for their clients. Accounts with invested funds average $22,635—roughly nine times larger than non-investment accounts.
For 2026, average HSA balances are projected to reach $4,400 with total HSA assets rising to $189 billion on 44 million accounts. About 20% of participants (up from 18%) are expected to have invested funds.
IRS sets the maximum allowable contribution for each year. In 2025, these are $4,300 or $8,550 for individuals or families, respectively. Those turning 55 by Dec 31 can contribute an additional $1,000 (“catch-up”). Allowable 2026 contributions for individuals or families increase to $4,400 or $8,750, respectively, with catch-up remaining the same.
I will continue next time with HSA investment planning.
Categories: Accountability, Financial Literacy | Comments (1) | PermalinkNear-Term Road Map
Posted by Mark on August 11, 2025 at 07:29 | Last modified: February 24, 2026 08:38I have multiple projects I wish to pursue in the near future.
With regard to blogging, I want to assemble an action plan based on the recently completed incident report [and of course publish the other one as well]. I want to explain Health Savings Accounts (HSA), what benefits they offer, and determine what investment approach I will use for mine. Similarly, I want to determine an investment approach for my IRA in terms of passive and broadly diversified (ETFs) with respect to work done by Craig Israelsen and Paul Merriman.
I want to give AT a good, hard look since I planned incorporate into my trading portfolio after last year’s debacle. Now that I finally finished the report linked above, it’s time to stop dragging my feet and follow-through here as well. Before actually reaching out to SO with questions and/or an offer, I should go back and review the series of articles written a few years ago. I may also try and refresh correspondence with TS for some ideas and background.
Speaking of modifying the trading plan, I’d like to give another look at 0 DTE approaches whether they be ORB, A14, or something else. I also want to take a closer look at QDTE as a repository for storing money I plan to deploy into stock purchases. Good places to start this examination may include articles here, here, and the video here.
I want to code my Positions spreadsheet to make adding new inventory easier (e.g. inserting new line and populating with all necessary components).
I want to review Python and create code to scrape sales and earnings estimates for FC reports. Maybe I can even develop some sort of AI script or prompts to help write some of the more formulaic paragraphs.
Finally, I want to refresh my math knowledge and look into tutoring either on a volunteer basis or with proceeds going to charity or non-profit(s). I’d also like to look into teaching investing concepts to students (high school) and maybe reaching out again to SGL for inspiration/direction to see what she’s done lately and also to KR of NE Ohio Chapter to hear more about her background and how I might get this started.
Categories: Accountability | Comments (1) | PermalinkIncident Report Aug 2024 (Part 2)
Posted by Mark on July 25, 2025 at 07:49 | Last modified: February 17, 2026 17:32I left off with reasons for encouragment in the midst of my August 2024 debacle. Also deserving of gratitude is the realization that even a return to making minimum theta can land me with a with decent YTD PnL despite a negative relative return.
Getting back to the meat of this incident report, when I look back I will see I could have escaped with no worse than a 10-15% drawdown rather than 25% or more. Better yet, I could have had my powder dry and ready to go instead of emotionally reeling and licking my wounds on the sidelines when Mr. Market chose to make a sudden reversal.
The following are indicators that I absolutely must monitor every single day (preferably in the form of a checklist):
- SD moves in the last five trading days: when we hit three then it’s time to do something.
- Spot VIX: when I see a solid close above the last several months then it’s time to do something.
- VIX term structure (as I have been doing): when it goes into backwardation then it’s time to do something. This may be too late for preliminary adjustments, though. Two grey areas worthy of future discussion include spot VIX rising into the term-structure range and partial backwardation.
- Daily ATR(14): when I see a move above the last few months then it’s time to do something.
- IV of option inventory: when any position increases 30-50% (relative not absolute), it may be time to do something. One caveat is the natural increase as expiration approaches making these positions okay to let expire if the underlying change (open) is positive. Otherwise don’t be shy: keep a clean kitchen and close the damn thing.
- NLV: be on notice when I see a bigger drop then I’ve seen in days. When I see the biggest weekly drop in the last few (several?) months then it’s time to say bye! Close positions or cut NPD and live to fight another day. Buying front-month protection for margin relief may be considered as an alternative to closing positions. If I am to close, perhaps managing winners and/or profitable contracts can be done first.
- When I feel myself hoping [not a financial strategy] for a market reversal, then it’s a huge red flag to get out.
As a final note, bonds created a new/different experience by limiting my cash balance. I may have BTC more on the Friday beforehand given additional buying power. Instead, I was forced to explore bond sales with less than one week to maturity [must phone brokerage directly for an institutional bid since this cannot be done online]. I could have done this within 30 minutes to get a bid but did not know or end up doing so.
In the future, look to raise cash at an earlier opportunity based on indicator(s) above to lessen risk to remaining balance should the hoping go awry [as it usually seems to do].
I do not monetize this blog and it is free for you to read. I can only imagine, though, how much this single post could be worth to traders of all experience levels…
Categories: Accountability | Comments (1) | PermalinkIncident Report Aug 2024 (Part 1)
Posted by Mark on July 22, 2025 at 06:54 | Last modified: February 16, 2026 16:24I have vowed to complete much unpublished content pertaining to catastrophic losses. I’m not talking general, theoretical terms like this mini-series defining what a catastrophic loss is, either.
I am talking about the detailed incident reports I aim to do after a horrendous drawdown in order to learn and prevent future recurrence. Unfortunately, the aftermath usually leaves me numb, paralyzed, and wanting to do ANYTHING BUT any sort of postmortem. I’d rather run and hide, bury my head in a pillow, and stay that way for a very long time. As discussed in these final three paragraphs, it’s demoralizing and depressing. Grief isn’t just for friends, family, loved ones, and pets. It’s for material and financial loss as well.
Today I will complete the first part of two such incident reports. The draft was written 10/9/24 about a recent losing incident. That would have been an acceptable delay except that I’m only finalizing it now: a full 18 months later. In any case, as you read keep in mind the writing is about an event two months earlier.
———————————
I’m sorry to report that August 2024 is my latest episode of catastrophic loss. August (perhaps starting mid-July? I’ll look back to see) has been ugliness in the making with VIX jumping from ~14 to 36 (65 intraday) at its worst point.
I meant to compose this entry the weekend of Aug 10, but I always seem to have trouble sitting down to document such bad news. Maybe it’s the impeding discussion of failure. The previous one was 2022 or 2023 and the delay was long. In this instance, enough time has passed such that I feel I know exactly what I’m going to write. I’ll be interested to compare this incident report with the last and I won’t be surprised if there are many overlaps. I had the plan then. I didn’t follow it. I still have the plan. I need to follow it. I can’t tolerate more sudden, extreme equity drops. It’s an emotional setback that takes a tremendous psychological toll. The current episode wiped almost six months of gains in very short order.
On the positive side, things could have been worse. I closed 25-33% of my total position on a Friday rather than waiting to see because the market was not yet fully into backwardation (surely other indicators were already firing, though). It’s important to acknowledge my own progress and celebrate the small wins. Another being my latest equity trough [hopefully] a stairstep higher than the previous meaning I did not give back all the gains. Despite still underperforming since the early part of 2019—which does not at all make for a good feeling—I should celebrate and take a victory lap.
I will continue next time.
Categories: Accountability, Option Trading | Comments (1) | Permalink2021 Performance Review (Part 11)
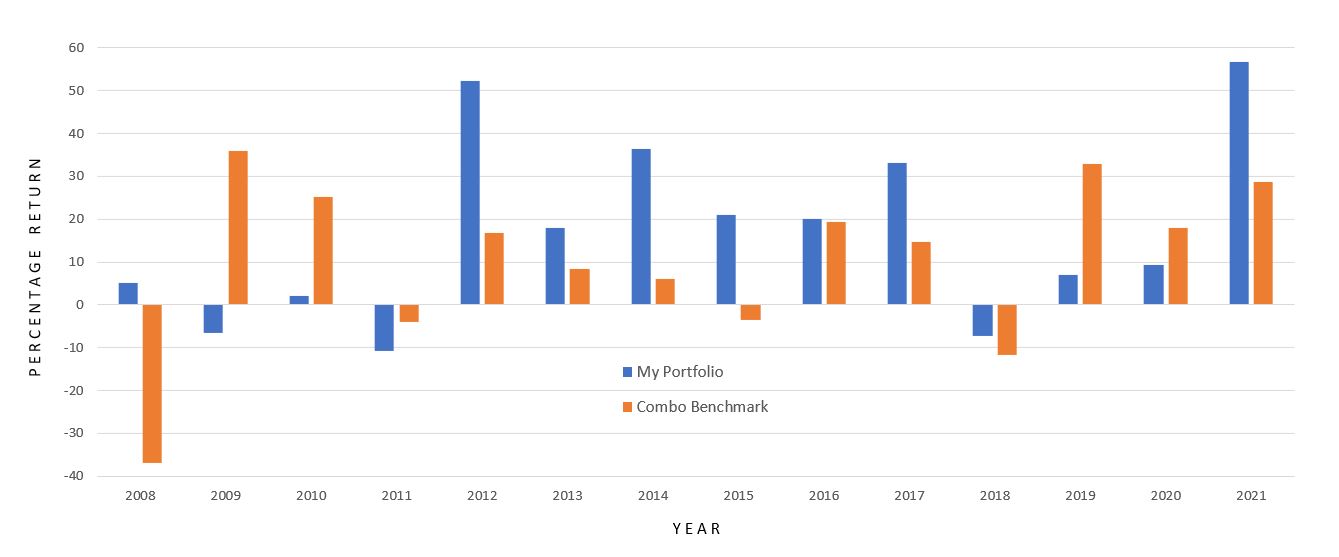
Posted by Mark on April 29, 2022 at 06:46 | Last modified: February 16, 2022 13:36To conclude this mini-series, I offer the annual time frame along with some additional miscellany still germane to my pursuit.
Here is my performance by year versus the combo benchmark:
As mentioned in the second-to-last paragraph of Part 10, calendar years conceal my maximum drawdown. That is not the intent and the data must be sliced differently to show everything, which I have done.
My trading has taken several different forms over the years.
I assumed management of my personal brokerage account in 2001 and implemented stock-screening strategies I researched and developed. I had a decent first month but was hit by the 2001 correction thereafter. My stock investments were mostly short-term although I had a couple that went on to become spectacular long-term winners. Those played a large part in allowing me to leave my full-time job at the end of 2007.
In 2008, I began to trade options full-time. Making money in 2008 is one of my finest accomplishments. I changed strategy a few times over the first five years and suffered a couple catastrophic losses from which I was able to rebound, but the pain was certainly real (see this blog mini-series). The Big Question going forward was how I would navigate the periodic pain?
This review has updated my performance to include the last five years of trading. During that time, I phased out one brokerage account and started with another. For a couple years I was trading different strategies in the two accounts. 2018 included two 10% corrections in the same year and explosive volatility. I did some soul-searching because of the unlimited-risk nature of my approach, and I spent most of 2019 in cash backtesting and refining to address liquidity concerns along with absolute risk. Soon after jumping back into the market, I got an exit signal in Feb 2020. The hit I took was mitigated (see last sentence of this second paragraph) as the market proceeded to sell off an additional 27%.
The bar graph above reveals how much I missed in 2019 being mostly out of the market. 2019 could have conceivably been another 2021, which ended up as my best year ever. Sometimes it hurts to be on the sidelines.
Despite the pain, this blog mini-series provides an answer to the Big Question: quite well with benchmark outperformance in excess of 6% p.a. since 2008. I hope to continue outperforming going forward, but there are no guarantees. Making this happen will take some luck, some discipline, and lots of effort.
Thus concludes my 2021 performance review showing my live-trading experience with all its bumps, bruises, and scars: 100% out-of-sample data, to be sure. None of the backtesting I have done over the years has been included here.
Categories: Accountability | Comments (0) | Permalink2021 Performance Review (Part 10)
Posted by Mark on April 26, 2022 at 06:50 | Last modified: February 15, 2022 11:01I left off discussing my ugly 2013 speculative GC trading experiment gone awry. While I paid a lot in “market tuition” to learn some important lessons, at issue here is that the combo index benchmark does not include GC.
Including the GC trades artificially lowers my relative return if coincident GC performance is not incorporated to the benchmark. I’m tempted to just leave it because I believe in erring on the side of conservatism. That’s really not fair to me, though. Besides, as previously discussed I have already assessed the tax penalty on more than I actually made.
The following will result in a combo benchmark (RUT / GC / SPX) with the adjective “index” removed:
- My speculative GC trades run from 2/13/2013 – 5/17/2013.
- According to GC prices at execution, the futures drop from 1648.1 to 1359.6: -$288,500/contract.
- Futures margin during my largest position size is $5,400/contract (increased shortly thereafter per CME website).
- Futures options use SPAN margining, but I do not have historical data on the SPAN stress factors.
- With GC crash volatility, I would guess stress factors to be +/- 15% (if not 18% or more).
- At -15%, requirements are similar to the futures margin mentioned above; this allows me to calculate ROI.
- The combo benchmark performance is then a weighted average of GC and RUT.
- I lump all GC losses into Apr 2013, which is when my big portfolio drawdown (DD) occurred.
Here is the revised (compare with graphs shown in Part 7) 2008 – 2021 cumulative performance comparison:
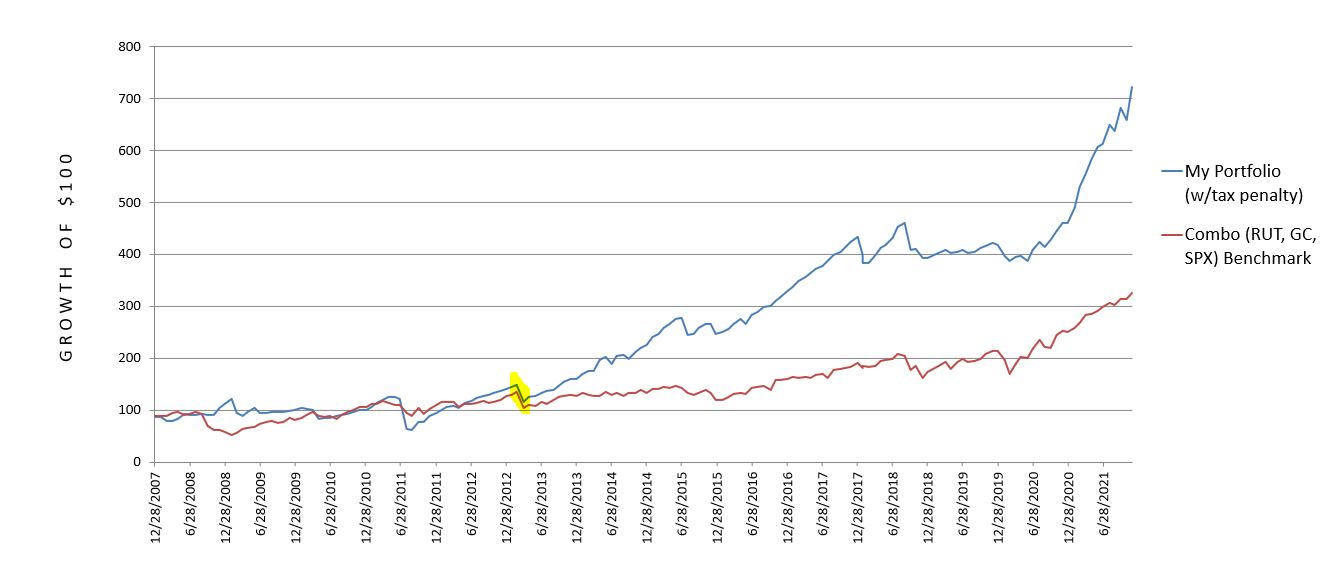
My annualized return remains at 15.17%, but the combo benchmark worsens from 10.75% to 8.80%. This boosts my outperformance from 4.42% p.a. to 6.37% p.a. and is a more accurate comparison.
Here is the new DD comparison with major revision highlighted.
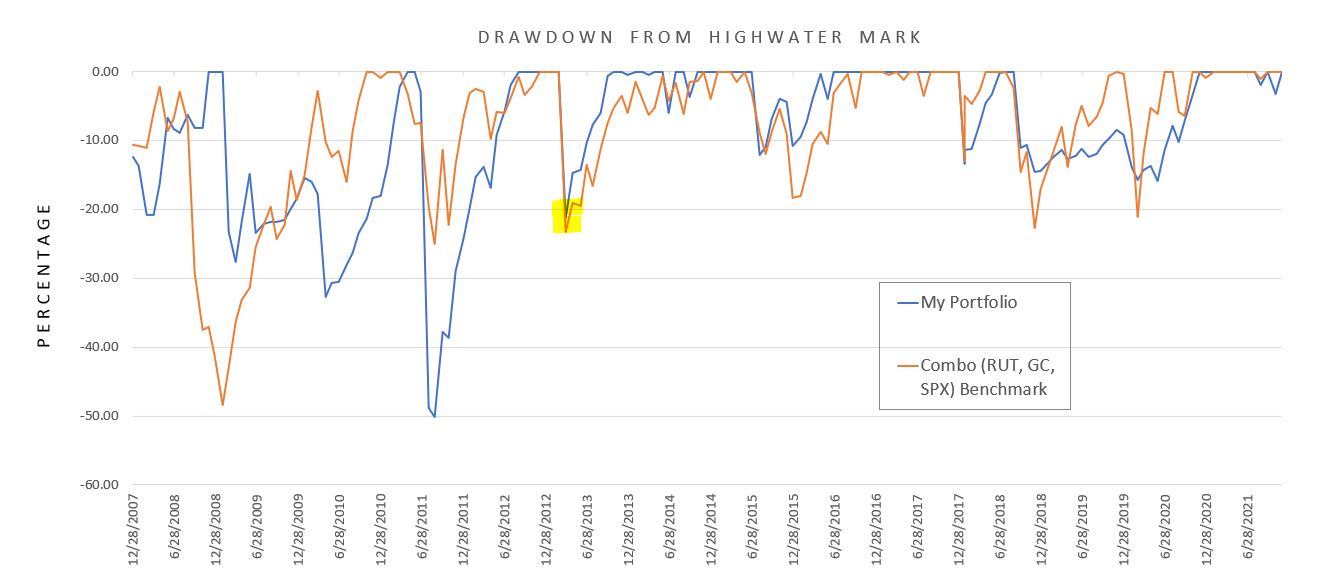
My mean DD remains at 8.86%, but the combo benchmark worsens from 7.17% to 7.92%. The max DD is unaffected.
I want to comment on something written here, which I was alarmed to see in preparing for the current performance review:
> I very much like the fact that my worst year was limited to just over a 10% loss.
> This is the kind of stability somewhat lacking to the upside. I experienced three
> catastrophic losses over the last nine years and the overall performance suggests
> I have bounced back quite well.
This is somewhat misleading. Yes, the look from a calendar-year perspective does speak to rapid recovery. It also paints a prettier picture than my current DD calculations that use a monthly time frame. Max DD of 50.10% for me vs. 48.39% for the combo benchmark better reflects the mental anguish suffered at the time.
I will continue next time.
Categories: Accountability | Comments (0) | Permalink2021 Performance Review (Part 9)
Posted by Mark on April 21, 2022 at 07:16 | Last modified: February 14, 2022 14:10I left off last time reviewing two of my largest drawdowns to consider whether such big losses might be avoided in the future. Nobody knows, of course, but while I’m at it I will take a look at one more that I completely overlooked.
In Apr 2013, I lost just over 21% when the combo index benchmark was down less than 2%. This is a unique situation because it happened in gold (GC). I was dabbling in some small trades just to get a feel for the market and I committed the fatal sin of doubling down and then basically doubling down again. This was particularly embarrassing because the equity market was doing fine—only a niche market paid attention by a few was getting destroyed, and I was part of the few.
Could a case have been made to exit now?
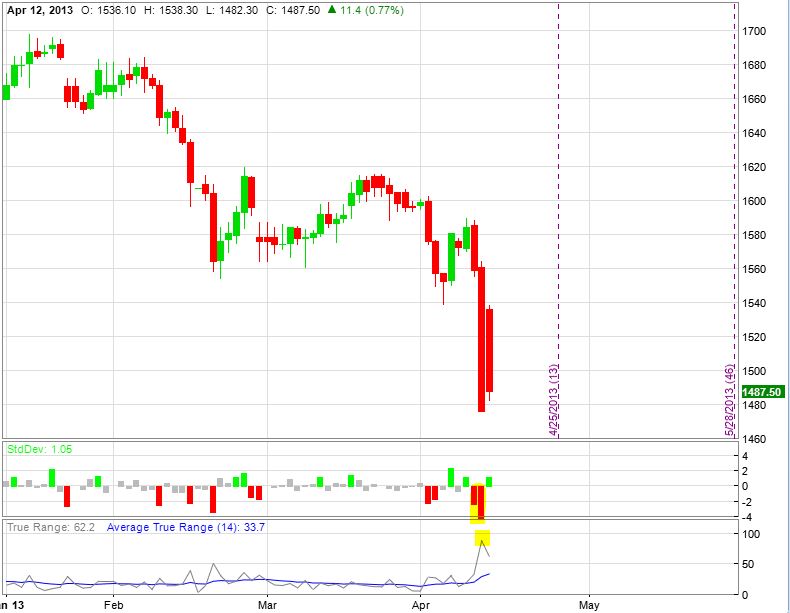
According to Reuters, this combined with the bloodshed during the next trading session was the worst 2-day gold rout in 30 years. I learned some powerful lessons from this (e.g. quit doubling down and mind stop-losses).
When things get crazy, I need to get out of the way. How to determine the craziness may not matter so much as just steering clear. Many potential indicators could be used with varying degrees of success.
You may have noticed my combo index benchmark (RUT and SPX) is not suitable for GC. I should probably correct this, and any correction will improve my relative performance. If I somehow integrate GC to the benchmark for a period of time, then the benchmark will suffer. Even if I underperform GC, GC significantly underperforms the benchmark portion it replaces.
I say “somehow” because determining how much to allocate to the GC trades is difficult. This is a leveraged, speculative [naked put] play that starts very small and goes horribly awry. The fairest way to proceed seems to be determining the margin requirement at max position size, and calculating the equity portion as a fraction of the total portfolio.
This experience scarred me to a point where I still have occasional trouble to this day. I will trade a new strategy in the smallest of size, which is good. When I take losses, though, then my interest wanes and I wait before trying the new strategy again (if ever). That is bad!
I feel quite confident to say this will not happen again. I no longer fight extra hard to avoid losses, and dramatically increasing trade size would be anathema to me.
As much as I might like to pretend the GC disaster didn’t happen, I certainly cannot justify excluding the trades because I saw them through and suffered heavy losses for which I should be held accountable.
I will continue next time.
Categories: Accountability | Comments (0) | Permalink2021 Performance Review (Part 8)
Posted by Mark on April 18, 2022 at 07:20 | Last modified: February 12, 2022 09:29I left off discussing drawdown (DD) statistics and my dissatisfaction with this aspect of my trading performance. My current maximum DD is the best it will ever be.
The DD [second] graph shown in Part 7 does suggest my risk management to be getting better. Since late 2013, benchmark pullbacks over 15% have been less for my portfolio: -11% vs. -18% in Jan 2016, -15% vs. -23% in Dec 2018, and -16% vs. -21% in Mar 2020. I may be even better on a daily basis than these end-of-month values reflect. In 2020 when SPX drops 34% (bottoming out on March 23), my account equity is down less than 12%.
I feel more risk-averse and cautious as I get older. This is a main reason why I made significant changes to my trading strategy in Dec 2018 to carry insurance at all times. Some people say as a mean-reverting asset class, volatility should be sold when high. A caveat is the rare case when “high” is a prelude to much higher: a chance I no longer wish to take.*
The big DDs are truly permanent losses and therefore worth some price (see this post) to avoid. My account can still reach a new post-DD high, but it won’t be as high as it would have otherwise been.
I’d like to present a few of the big drawdown periods along with the million-dollar question: is there anything I can do to avoid these kinds of equity drops?
In the May 2010 Flash Crash, I lose 32.77% with the combo index benchmark down 10.23%. I’ve heard a lot of traders say “the writing was on the wall” for this one. What do you think?
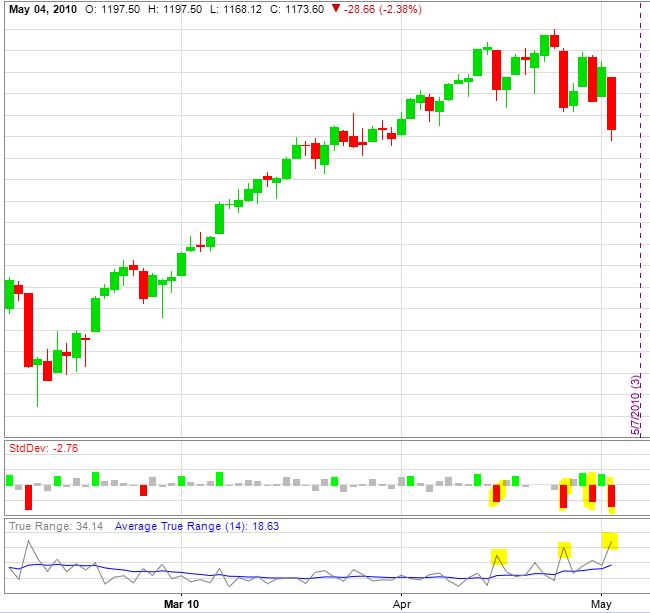
If this is going to be my signal, then I need to be ready to take action immediately. I should also be prepared for a near-term profit vacuum due to lag time before I get a full position in place once again.
On the upside: “cash is a position too.” On the downside: “opportunity cost, baby.”
At first glance, the volatility story ahead of the Flash Crash is somewhat equivocal. Only in hindsight is closing up shop and preparing for the worst an easy decision.
Aug 2011 is catastrophic with a loss just over 50% vs. the combo benchmark down half that. Do you see what comes next?
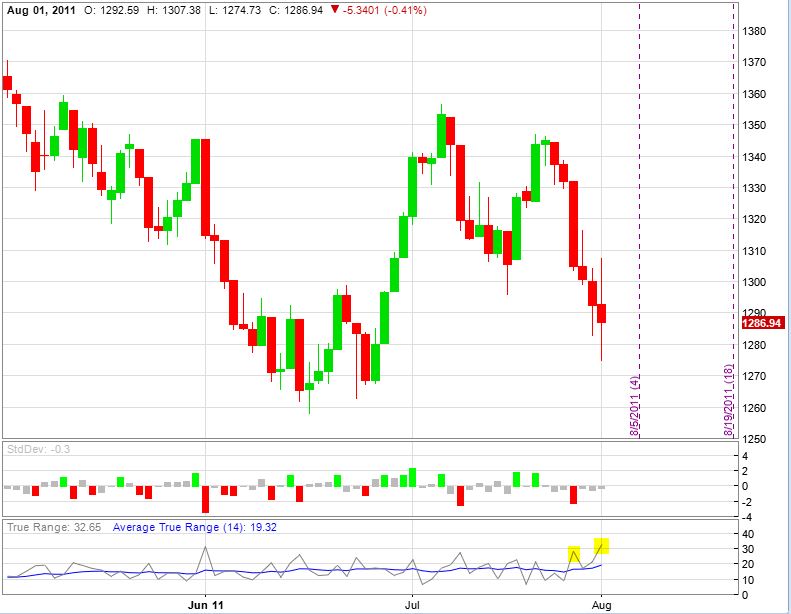
This is much less convincing to me from a technical standpoint. The volatility story, however, is unequivocal.
Neither of these are smooth sailing, per se, but if sufficient to sound the alarm then how many profitable opportunities will be missed and how will that affect long-term performance?
It bears repeating: only in hindsight is closing up shop and preparing for the worst an easy decision.
I will continue next time with one more case study.
* — The story may be different for a client who hires me to manage 10-20% of their portfolio
and target outsized returns knowing the most they can lose is a fraction of their total.