Trading Epic Fury (Part 15)
Posted by Mark on April 27, 2026 at 07:58 | Last modified: May 9, 2026 16:01Aside from using TA, another way to get positive delta (NPD) is simply to respect the stop-loss.
I use a stop-loss with most of my trading to exit positions that go against me. If I sell a put [spread] for $3.00, for example, then a 3x stop loss means I would close if it increases to $9.00 or more. (6) here illustrates a sample strategy.
Perhaps because I don’t sell calls very often, I generally do not use an upside stop-loss. When I “campaign,” I look to roll out and up for a credit as expiration approaches. I also watch the portfolio greeks (i.e. the “net position” aspect of NPD or NPV discussed in Part 14). In a typical market with positive drift, I’m okay holding DITM short calls as long as NPD is positive, which I have done most of the last few years.
Closing short calls increases NPD by effectively buying the call: a positive delta event. Respecting the stop-loss does this.
The consequences of campaigning (no stop-loss) can be shocking when studied in isolation. Recall (3) from Part 7. The 2 DTE 6400 calls were sold for $21.30. While most have since been closed, a couple have been campaigned and now sit at the 6500 strike priced ~$910: an unrealized loss over 25x including a few rolls to capture additional premium!
The potential savings realized by respecting the stop-loss and closing everything the very next day is staggering. I mentioned a “windfall” in the fourth paragraph of Part 14 by getting positive NPD near the right chart arrow of Part 12. Now I’m entertaining the idea of getting positive NPD at the left chart arrow with SPX even lower [by ~40 points].
Caution is warranted, however, as NPD would be much greater after closing all the stopped-out calls. That represents significant risk in case the unidirectional rebound (V-bottom) does not materialize—and right on the heels of a big losing day, too (albeit not as bad as two days prior).
There is no easy, guaranteed answer.
As I go through the analysis and tab certain concepts for inclusion on a daily trade management checklist, one challenge is to avoid conflicting guidelines. Remember the penultimate guideline here that might have had me closing 50-100% of the position after this day [“two days prior” from two paragraphs above]. The consideration about respecting stop-loss would be largely moot [and I would have been in the catbird seat just 2% off my equity ATH where getting positive NPD after the left or right arrow could have subsequently added further to profits].
Beware of 20/20 hindsight. I don’t want to think I could do anything heroic that would have seemed murky in the moment.
Categories: Option Trading | Comments (0) | PermalinkTrading Epic Fury (Part 14)
Posted by Mark on April 24, 2026 at 07:36 | Last modified: May 8, 2026 09:00Today I continue discussing the potential benefit of technical analysis (TA) as a trigger to get positive delta.
I want to make one clarification regarding equivalent terms: delta and net position delta (NPD). The former refers to one particular option whereas the latter refers to summation across the entire option inventory. I mean the latter in all cases despite using them interchangeably.
In Part 13, I explain where SPX crosses above the 20-SMA. Since I don’t actually know this until the close and because trading takes time, let’s be conservative and assume I wait an extra day for confirmation (Apr 7). The goal would be to maintain positive NPD thereafter by closing short calls as needed.
How much positive NPD to target is debatable but a good starting point would be equal theta:delta with opposite sign. This represents a windfall with the account on Apr 7 less than 4% off its high and every subsequent day then being profitable.
I would also be in position to capitalize on some volatility contraction [due to negative net position vega (NPV): see fifth paragraph here]. A massive upmove on Apr 8 drives VIX 4.8 points lower to ~21 but negative delta by the close would offset some negative-NPV gains. Most remaining short calls would probably be closed to re-establish positive NPD thereby allowing all remaining volatility contraction (e.g. on Apr 9 to 19.5 VIX drifting lower to 17.5 on Apr 17) to be realized profit.
With that as best-case scenario, second-best would probably be to target delta neutrality. The result would pit negative NPD by the close on some days against negative NPV and positive theta. I would still expect profitability over the next couple weeks.
The reality was negative NPD for two weeks beginning on Apr 1 as I gradually closed DITM short calls. SPX rallied 8.4% while my NLV sank 2.6%. Since crossing above the 20-SMA, SPX has rallied 1+ SD (close-to-close) six times with zero such down days. The train indeed left the station and, at least so far, has not looked back.
Market activity over the last several years suggests V-bottoms to be commonplace, but I always like to play devil’s advocate and consider other possibilities. When the market goes into correction, it has behooved us to look for signs of reversal in preparation for a strong rebound. TA can help with this but as stated in Part 12, TA is notoriously bad with prediction. The preceding five paragraphs could have been null and void were the Mar 30 low (left arrow from Part 12) taken out.
Stated another way, the table in Part 13 puts me in a mindset where these quick recoveries are doctrine but behold 2022! In the future, the only thing likely guaranteed is that change will eventually step to the fore.
I will continue next time with discussion of stop-losses.
Categories: Option Trading | Comments (1) | PermalinkTrading Epic Fury (Part 13)
Posted by Mark on April 21, 2026 at 06:45 | Last modified: May 7, 2026 14:36Now on the other side of Epic Fury recovery, I discuss the bullish case in Part 12 with regard to news and technical analysis. The latter is a potential trigger to get positive delta.
It’s hard to be sure, but over the last few years it feels like I have lost money with short calls. I often close a call and sell a put(s) to cover the cost. This masks the loss and unless I sell more puts and take on more downside exposure, my overall return will lag. The maneuver effectively extends time required to realize the initial profit thereby diluting annualized return.
The latter is juxtaposed with the benefit of otherwise wasting upside margin. Maintaining permanent downside exposure gives me the opportunity to take on some upside [exposure] with no additional [portfolio] margin requirement. Perhaps I might as well even if it’s limited [which unfortunately was not the case on too many candles beyond the Part 12 chart’s left arrow].
Whether or not I have actually lost money selling calls, looking at the bear markets and market corrections since 2008 makes it clear that recoveries have generally been quick (courtesy Google AI):
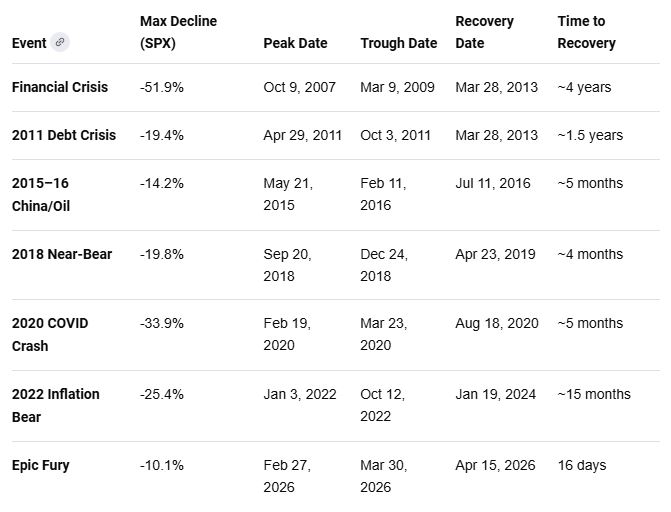
COVID is the fastest recovery from a 30%+ decline in history. Epic Fury is shallower and takes only a couple weeks to recover. Previous declines in 2018 and 2015-16 are also swift once the bottom is reached. Moral of the story: when the train leaves the station, I better be aboard.
What I am about to discuss would have worked for Epic Fury. Based on these quick recovery times, I suspect it would have also worked for other declines. It will be instructive to revisit these periods, though, to assess the worrisome whipsaw potential. I worry about removing upside exposure in favor of [more] downside only to immediately see the previous low taken out. That can devastate NLV and result in catastrophic loss.
Technicals can help determine when the train starts rolling. My gut feel (probably worth very little) tells me that while [price closes above the] 50- and 200-SMA are good recovery indicators, my trading may require a shorter period. This certainly applies to Epic Fury where I employed shorter and shorter-dated options including many at 0-1 DTE. The 20-SMA, reclaimed two candles before that [Part 12] left arrow, seems better suited and a significant event in and of itself being the first time since Epic Fury the market actually closes above [the 20-SMA or middle Bollinger Band].
I will continue next time.
Categories: Option Trading | Comments (1) | PermalinkThe Revenge Trade
Posted by Mark on November 6, 2025 at 07:16 | Last modified: April 9, 2026 07:53I mentioned revenge trading in the the sixth paragraph of [Epic Fury] Part 9. Today I want to fully discuss the concept.
Google AI defines revenge trading as an impulsive, emotionally driven behavior where one attempts to quickly recover from a significant loss by entering new, often larger, trades without a clear strategy. The behavior is frequently compared to going “on tilt” in poker, where frustration replaces logic and leads to reckless decision-making.
Breaking it down further, revenge trading:
- Is motivated by anger, fear, or a desire to “beat the market” rather than objective analysis.
- Increases risk by doubling or tripling position size to recoup losses faster.
- Involves taking consecutive, “rapid-fire” trades without waiting for valid setups.
- Typically ignores predefined risk management such as stop-losses and trade plans.
Psychologically, revenge trading may occur for a few different reasons:
- Pain of loss may be felt twice as strongly as joy of equivalent gain creating urgent biological need to “fix” the situation.
- Ego leads traders to feel personally slighted by the market with a subsequent desire to prove being “right” rather than admitting a mistake.
- Gambler’s fallacy is the mistaken belief that a big win is “due” after several losses.
- The illusion of control means taking any action, even a poor one, feels better than sitting helpless with a loss.
If revenge trading becomes a continuing problem, then the trading plan should be altered to prevent it. Incorporate mandatory cooldowns by physically walking away from the screen after a loss to reset the mind. Institute daily loss limits where action is halted after reaching a specific dollar loss or number of [consecutive] losing trades.
Journaling can help by tracking emotions felt during revenge trading to identify personal triggers. In thoughts and writing, make an effort to shift focus away from daily PnL to strict trade plan adherence. As with sports, sometimes the other team is just better that day but sticking with a well-thought-out plan puts the probabilities in your favor.
I believe this was my version of revenge trading. I don’t feel slighted or angry, per se. I do feel a need to act quickly and get on with a new plan that will recoup the losses and maintain the gradually upsloping equity curve. I don’t really think so much—it just becomes my [automated] mission in the moment and I may not process all relevant details (e.g. ignoring the red flags discussed in Parts 9 and 10) before moving forward.
The current instance of revenge trading robbed me of the volatility opportunity discussed in Part 7’s fifth paragraph.
Categories: Option Trading | Comments (0) | PermalinkTrading Epic Fury (Part 3)
Posted by Mark on October 6, 2025 at 07:33 | Last modified: March 23, 2026 09:36Before moving on, I want to go back to the bottom screenshot in Part 2 and discuss the first arrow (Feb 5) with regard to the second bullet point here. Is that a time to do something?
I need to explain what I mean by “strong close.” I don’t have a quantitative (objective) definition and probably wouldn’t try to come up with one without rigorous backtesting [a whole other discussion]. I’m also not looking for “perfect,” which doesn’t exist. If the market starts acting wonky and this strong close indicator doesn’t trigger, then another of the six probably will.
Having said all that, my qualitative concept of the “strong close” indicator is something like:
- Wide-ranging bar.
- Close higher than the open.
- Close at candle high as a long upside wick suggests rejection of volatility.
- Close is substantially higher than anything in the past few weeks/months.
- Not a doji.
To assess whether Feb 5 is a positive trigger, I need to zoom out on VIX daily. The following chart goes back to Oct 2025:
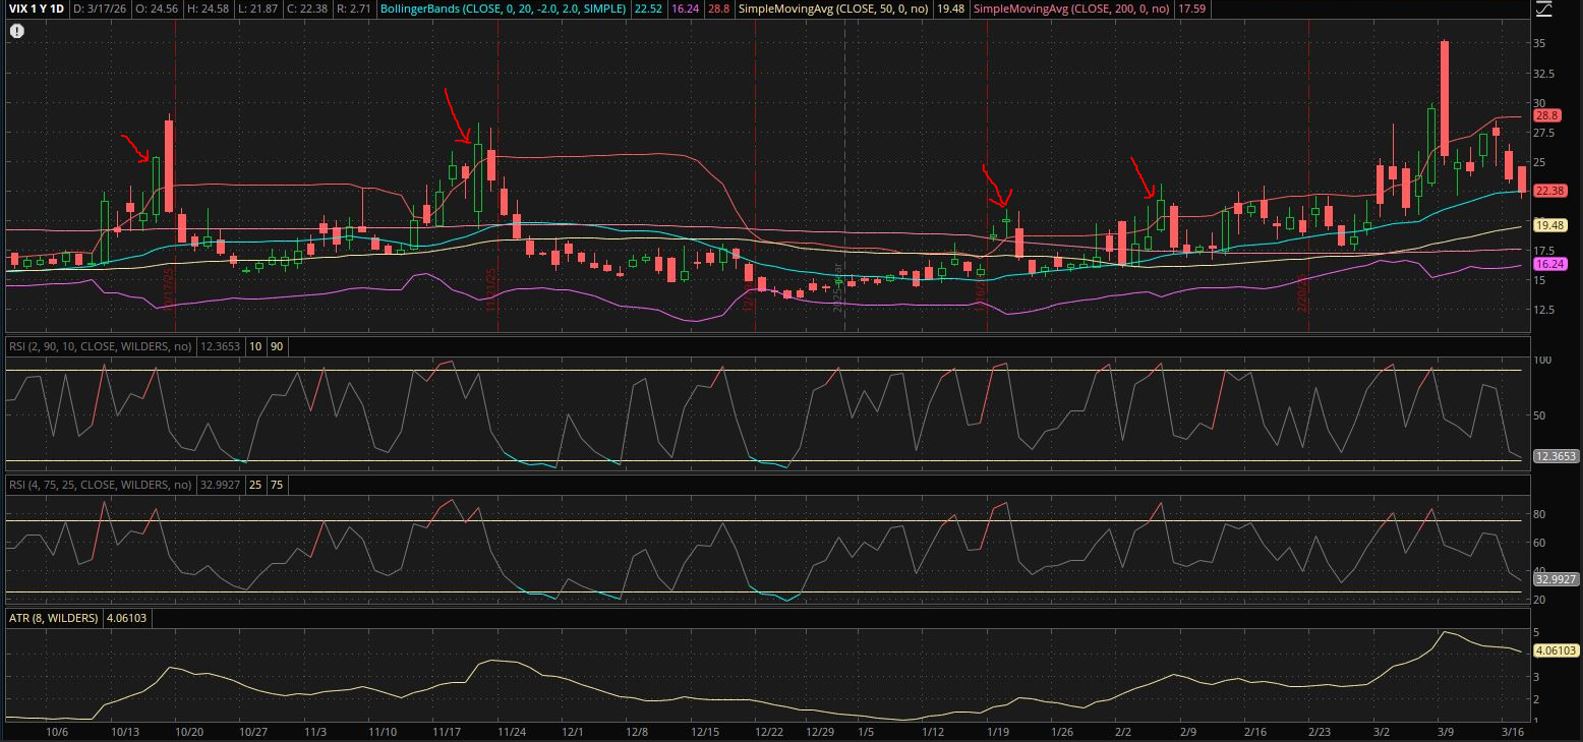
All four annotated candles are closing highs over the recent past. The first arrow is wide-ranging and the strongest because it closes at session high [impactfulness is directly proportional to lookback period and although I’d have to scroll chart left to determine the period, here I just want to illustrate “wide-ranging”]. The second arrow is a higher close that has an upside wick and does not exceed the open of the large down candle following the first arrow: not a great exemplar for strength. The third arrow is a doji: not impressive despite being a 6-week high. A case could be made one candle earlier because while the tombstone is not wide-ranging, this is substantially higher than the previous month due to gapping up.
The fourth arrow—Feb 5—does not seem to be a “strong close.” It’s the highest close in over two months but only marginally higher than the third arrow. It is [probably] wide-ranging but has an upside wick. The qualitative criteria are really intended to specify a case that is clear-cut, blatant, indisputable, and decisive. Year-to-date volatility has trended up with higher highs but I haven’t seen a sudden, huge volatility explosion that might signify the storm is now upon us and buckle down the hatches!
I will continue next time.
Categories: Option Trading | Comments (0) | PermalinkSimple SPX Put Credit Spread Strategy (Part 3)
Posted by Mark on September 25, 2025 at 07:40 | Last modified: March 12, 2026 09:50Today I want to wrap up discussion of the simple (I hope!) put credit spread strategy whose guidelines are provided here.
Continuing the discussion of strategy tweaks, instead of entering on a down day I could just enter every first (or second, third, fourth, or last) trading day of the week. My concern is missing a trade and throwing off the once/week to better define total risk. Historically, down days occur 45-47% of the time so I’m almost guaranteed to have one down day every trading week. And if I don’t then why not just take two the following week? I can’t think of a good reason unless entering on down days does not really provide a volatility advantage (in which case why do it?). It certainly can provide a volatility advantage (farther OTM can mean larger margin of safety unless volatility continues to increase) so I might as well.
A more extreme consideration would be to enter after consecutive down days. This should most certainly provide some volatility advantage at the cost of fewer occurrences. Historically, the chance of a down day is 46% with chance of a consecutive down day a bit less. Conservatively, then, I could estimate 0.44 * 0.34 * 100% * 99 pairs = 14.8 instances every 100 trading days. Also keep in mind that down days tend to cluster during periods of high probability. I could have some intervals of 100 trading days where consecutive down days happen only 7-10 times versus others where they may happen 30 or more times. The risk is having fewer trades on during market environments almost certain to produce winners while maxing out risk during market environments more likely to produce losers.
Since it’s tough to predict these things (especially given past performance is no guarantee of future results), maybe I employ Occam’s razor and enter on trading day #1 (or #2 or #3 or #4 or last) of every week. Another potential benefit to this is spreading out entry points as opposed to having a slew of trades on consecutive days that could lead to more short contracts at the same strikes. The latter is a concern because I’d hate to have lots of contracts at one strike that will all close at stop-loss as opposed to put spreads 25-50 points apart, for example, where only one or two might be stopped out.
Besides “trade every X days and always have Y trades open” to eliminate variability in exposure from “on a down day” or “at swing lows,” etc. (most of which I just discussed above), the strategy may be tweaked in several other ways such as:
- Selling other short deltas (e.g. instead of 10, look for 16, 20, 30, etc.).
- Varying the spread width (e.g. 10, 50, 75, or 100 points).
- Taking profits at different percentage of net credit (e.g. 25%, 80%, 90%).
- Using different stop-loss (e.g. 2x net credit, 4x net credit, etc.).
I could go on deliberating but for the most part, it’s a simple strategy and rather than overthinking just proceed with one contract/week to see what happens. That’s my plan going forward and once I have some closed trades under my belt, I can analyze how it’s going or look closer at any single trade.
Categories: Option Trading | Comments (0) | PermalinkSimple SPX Put Credit Spread Strategy (Part 2)
Posted by Mark on September 22, 2025 at 07:38 | Last modified: March 11, 2026 20:23Today I want to give more details about the simple (hopefully) SPX put credit spread strategy.
Much of what I said in Part 1 can be expanded but I will start with some benefits about trading SPX:
- SPX is highly liquid to minimize transaction fees (perhaps the only thing always lost when trading securities).
- SPX options are Section 1256 that means favorable tax treatment (60% long-term capital gains and 40% short-term despite holding period being far less than one year).
- Underlying index has no earnings events to be avoided.
- Cash-settlement avoids the risk of being assigned 100 shares per contract.
- European exercise means no early assignment risk.
- Plethora of expirations available (e.g. AM-settled, PM-settled, Weeklys, Monthlys, Quarterlys, etc.).
Expectancy is the long-term average profit across many trades: (% wins * mean win) – (% losses * mean loss).
Supposing average spread is sold for $1.00 with $3.00 max loss and 80% winners:
Expectancy = [0.8 * ($100 * 0.5)] – (0.2 * $200) = $0 (breakeven).
Although each spread is sold for $1.00 (100 multiplier to get $100/contract), recall profits are taken at 50% net credit = $50 and losses closed for 3x initial credit result in a net loss of $3.00 – $1.00 (credit initially received) = $2.00 ($200/contract).
Supposing the strategy produces 85% winners:
Expectancy = [0.85 * ($100 * 0.5)] – (0.15 * 200) = $12.50/trade.
Supposing the strategy produces 90% winners:
Expectancy = [0.90 * ($100 * 0.5)] – (0.10 * 200) = $25.00/trade.
With the spread being 25 points, the net risk is $2,500/contract minus initial credit. To calculate Return on Risk (ROR), divide expectancy by net risk. ROR for 85% winners is therefore [ $12.50 / ($2,500 – $100) ] * 100% = 0.52%. If average trade is 3-4 weeks then roughly one trade per month is (0.52% * 12) ~ 6.2% per year.
While I am admittedly underwhelmed by that number, the calculation does use conservative inputs. Win percentage will probably be higher and days in trade will probably be lower.
Capital usage is not understated and difficult to quantify. ROR denominator is the maximum amount of capital ever allocated to the strategy. The number of open trades will constantly vary so returns are going to be somewhat diluted by additional cash on the sidelines as dry powder.
Setting a maximum number of open trades is one way to limit capital usage. For example, no more than one trade allowed per week with no more than four trades open at any given time limits total risk to $2,400 * 4 = $9,600. A total return can now be calculated by dividing net profit by $9,600.
Here are some other ideas to consider:
- Add no new trades if SPX is below its 50-SMA as losses tend to cluster around sharp market downturns [rare].
- In addition to down days, consider opening trades when SPX is near swing lows.
- Section 1256 underlyings offering favorable tax treatment but worse liquidity and fewer expirations: XSP, NDX, and RSP.
I will continue next time with more potential strategy tweaks.
Categories: Option Trading | Comments (0) | PermalinkSimple SPX Put Credit Spread Strategy (Part 1)
Posted by Mark on September 16, 2025 at 06:38 | Last modified: March 10, 2026 14:13Today I am going to discuss a relatively simple S&P 500 (SPX) put credit spread strategy.
The goal here is to enhance my routine with more discipline. I already check the market around the same time every trading day and usually execute something [may or may not be a good thing]. I track my balances and margin requirements daily. I track bond purchases and the greeks (related to this post but something seems different lately that has rendered some of these triggers less important—potentially a separate discussion altogether): theta, delta, gamma, and vega.
As discussed in the third paragraph here, after repeated episodes of catastrophic loss I want to do something different. A simple strategy will suffice until I do more research to develop that next step.
The strategy is as follows:
- When market is down at 3:50 PM ET, sell an AM-settled SPX put spread 45-60 DTE.
- Sell the farthest OTM 25-point put strike that is 10-delta or higher and buy to cover 25 points below.
- Enter GTC order to close the spread at 50% of the initial credit received after factoring in all fees.
- Stop-loss will be 3x initial credit (for a net loss of 2x initial credit or roughly 4x the average winner).
I think the biggest challenge facing the strategy is closing at stop-loss. I would not use a GTC (or OCO) closing order because quirky option quotes happen and I’d hate to get taken out when the market is proceeding with normalcy and no hint of turbulence. One approach I could use is:
- Walk the option chain NTM by 25-point strikes to identify first closing spread for at least 2x opening credit.
- Subtract difference between identified short strike and positional short strike.
- Subtract (2) from current SPX price.
- Set an “equal to or below” price alert on SPX for (3).
- Upon receiving alert, go into the trading platform and monitor the position with live quotes.
- Close spread with limit order should it reach 3x initial credit.
Whether to close with a market or limit order is debatable and some experimentation may be worthwhile. SPX options are generally liquid enough to use market orders with good execution. I still think a limit order leaving ample room for slippage (e.g. $0.10 – $0.25) is preferable especially because of the occasional fluke quote mentioned above. “Experimentation” means limit order close enough times to make for a valid sample size, which could take months or years. Losses don’t typically occur often with this strategy and they generally cluster around periods of heightened market volatility.
I will continue next time.
Categories: Option Trading | Comments (1) | PermalinkIncident Report Aug 2024 (Part 1)
Posted by Mark on July 22, 2025 at 06:54 | Last modified: February 16, 2026 16:24I have vowed to complete much unpublished content pertaining to catastrophic losses. I’m not talking general, theoretical terms like this mini-series defining what a catastrophic loss is, either.
I am talking about the detailed incident reports I aim to do after a horrendous drawdown in order to learn and prevent future recurrence. Unfortunately, the aftermath usually leaves me numb, paralyzed, and wanting to do ANYTHING BUT any sort of postmortem. I’d rather run and hide, bury my head in a pillow, and stay that way for a very long time. As discussed in these final three paragraphs, it’s demoralizing and depressing. Grief isn’t just for friends, family, loved ones, and pets. It’s for material and financial loss as well.
Today I will complete the first part of two such incident reports. The draft was written 10/9/24 about a recent losing incident. That would have been an acceptable delay except that I’m only finalizing it now: a full 18 months later. In any case, as you read keep in mind the writing is about an event two months earlier.
———————————
I’m sorry to report that August 2024 is my latest episode of catastrophic loss. August (perhaps starting mid-July? I’ll look back to see) has been ugliness in the making with VIX jumping from ~14 to 36 (65 intraday) at its worst point.
I meant to compose this entry the weekend of Aug 10, but I always seem to have trouble sitting down to document such bad news. Maybe it’s the impeding discussion of failure. The previous one was 2022 or 2023 and the delay was long. In this instance, enough time has passed such that I feel I know exactly what I’m going to write. I’ll be interested to compare this incident report with the last and I won’t be surprised if there are many overlaps. I had the plan then. I didn’t follow it. I still have the plan. I need to follow it. I can’t tolerate more sudden, extreme equity drops. It’s an emotional setback that takes a tremendous psychological toll. The current episode wiped almost six months of gains in very short order.
On the positive side, things could have been worse. I closed 25-33% of my total position on a Friday rather than waiting to see because the market was not yet fully into backwardation (surely other indicators were already firing, though). It’s important to acknowledge my own progress and celebrate the small wins. Another being my latest equity trough [hopefully] a stairstep higher than the previous meaning I did not give back all the gains. Despite still underperforming since the early part of 2019—which does not at all make for a good feeling—I should celebrate and take a victory lap.
I will continue next time.
Categories: Accountability, Option Trading | Comments (2) | PermalinkMarket Measures: An AI Take
Posted by Mark on December 12, 2024 at 07:00 | Last modified: April 18, 2025 09:48I mentioned Market Measures (MM) in the last post. Before going into details about particular episodes, I want to provide an overview of what MM is.
In this day and age, I feel the necessity to get familiar with and lean on AI. To that end, I have asked Perplexity to help us out:
MM is a segment on tastylive that focuses on advanced trading mechanics and analysis.
It aims to provide traders with in-depth insights into various aspects of the
market, regardless of their experience level. The show covers a wide range of
topics, including:
1. Options probabilities and volatility
2. Trading strategies for options and futures
3. Analysis of market behavior and trends
Recent episodes of MM have explored:
1. Exit times and profit targets for zero-DTE options
2. Optimal profit targets for different delta strangles and 45 DTE trades
3. Intraday market behavior analysis, including volume patterns and index movements
The segment uses data-driven approaches to examine trading mechanics, helping viewers
build strategies to manage more winning trades. By delving into complex market
dynamics, MM equips traders with the knowledge to make informed decisions and
refine their trading techniques.
Google Generative AI gives us:
MM by Tastytrade, hosted on platforms like Tastytrade, analyzes market volatility,
reversal probabilities, and trading strategies, offering insights for traders to
improve their decision-making.
MM delves into various aspects of market analysis, including:
1. Volatility and Reversal Probabilities: Analyzing market swings and predicting
potential reversals.
2. Trading Strategies: Exploring different approaches to trading, including options,
futures, and more.
3. Market Dynamics: Understanding the underlying forces and structures that drive
market behavior.
Key Concepts:
Market Profile Analysis: A method of analyzing market data to identify value areas,
price rejection points, and the strength of buyers and sellers.
Contrarian Trading: Strategies that capitalize on market reversals after
significant moves.
Examples:
“How Long Does Market Chaos Last?”: An episode that examines the duration of market
volatility.
“Since 1994: Market Reversal Data Revealed”: An episode that analyzes historical
market data to identify patterns of reversal.
Benefits for Traders:
Improved Decision-Making: By understanding market dynamics and potential risks,
traders can make more informed decisions.
Enhanced Trading Strategies: The show provides insights into various trading
strategies and techniques.
Risk Management: Learning about volatility and reversal probabilities can help
traders manage their risk effectively.
Besides never seeing anything on Market Profile Analysis, I think this to be a solid overview.
The segment generally lasts 10-20 minutes and is produced ~4 times per week. Most present a Research Team study that has taken tens of man-hours to complete. Segments are generally hosted by Tom Sosnoff and Tony Battista. Members of the Research Team occasionally make appearances to provide added technical expertise. Tom Preston also makes an occasional appearance. These folks represent a tremendous amount of floor trading, data science, and option modeling experience.
All MM episodes are archived on the tastytrade website along with slides for each segment.
Next time, I will pick up in mid-2019 with a deeper look at particular segments.
Categories: Option Trading | Comments (0) | Permalink