Practice Trades BWB+Cal 1.1
Posted by Mark on January 13, 2022 at 07:00 | Last modified: December 10, 2021 14:28Practice Trades BWB+Cal correspond to the following general guidelines:
- With 14 DTE, buy first above-the-money 40/60 BWB.
- Use 10-point strikes only and TF $21/contract.
- If underlying exceeds upper strike then buy calendar above the money.
- If underlying exceeds upside calendar strike then [close downside Cal if needed and] buy Cal above the money.
- If T+x lines underwater, then calendarize upper leg of BWB to raise (else close).
- If underlying falls below 25-yard line of BWB then [close upside Cal if necessary and] buy Cal below the money.
- If underlying falls below downside calendar strike then roll calendar below the money.
- If T+x lines underwater, then calendarize lower leg of BWB to raise (else close).
- PT 5%
- Monitor position once daily and adjust as needed.
The wings may be adjusted to 30/40, 50/60, 40/50, etc. in order to limit initial NPD, which should ideally be slightly negative. The short strike may also be split although this may make execution more complex.
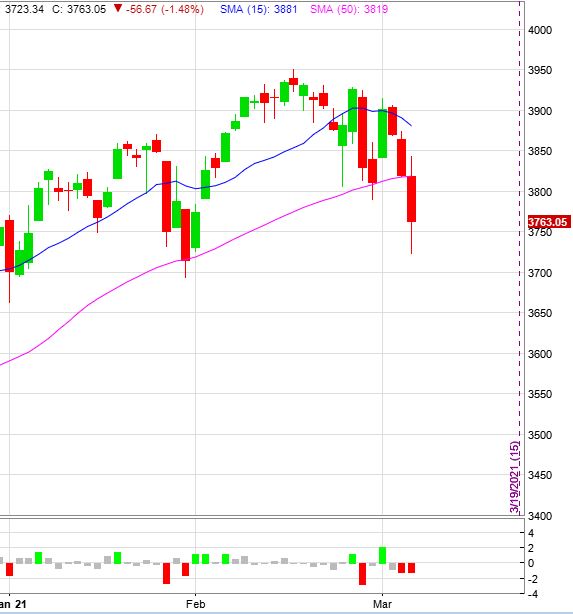
This trade begins 3/18/21 (14 DTE) down $840 (max DD). MR is $7,015 (five contracts), PT is $7,015 * 0.05 = $351.
At trade inception, TD = 36, IV 17.1, NPD = -1.78, and NPV = -122.
First adjustment occurs very next trading day with max margin increasing to $11,285.
Second adjustment occurs on 3/26/21 (8 DIT) by rolling up calendar and calendarizing two of the five upside wing contracts. This increases margin to $14,238.
On 3/30/21 (2 DIT), exit trade for 7.2% on max margin with market up 0.32 SD in 12 days. IV decreased 18%.
I have two general comments.
First, I suspect $21/contract TF is much more than I should normally see in live trading (this amounts to ~12% initial margin with a PT of 5%, which seems preposterous). If this works out okay in backtesting or on paper, then it should work out well. As I do some of these live, I should get a good feel for what number to expect.
Finally, I’m a bit unclear as to whether I should use PT as a percentage of initial margin, current margin, or max margin. Until I see reason to change, I will use the latter. This does mean, however, that the trade should always be done with a limited portion to account for margin more than doubling upon adjustment.
Categories: Option Trading | Comments (0) | PermalinkPractice Trades: IC 1.1
Posted by Mark on January 10, 2022 at 07:47 | Last modified: December 9, 2021 17:19Whether important or not, I’m not happy about my trade diversity last year. In an attempt to push the envelope and improve, I’m going to start spending more blog time posting practice trades.
A practice trade may be live, paper, or backtested. Live and paper trades are both followed in real-time. Backtested trades are done completely in hindsight.
My goal in doing this is to gain more familiarity. Period. I want to be able to place these trades as if they are second nature. My bread-and-butter strategy has been repeated daily for months. I want to feel equally comfortable with others.
As seen in the post title, I am calling these “Practice Trades.” The subsequent code describes type of trade, trade number of the methodology referenced, and methodology (seen after the dot). I may or may not go into detail about the specific trade plan since my goal is not to wax eloquently about the pros, cons, and potential strategy variants. You’re always welcome to post questions or comments below.
Today, I will include the following methodology:
- Place in SPX monthly cycle 60-90 DTE using 25-point strikes and include TF $21/contract.
- Sell NTM option < delta 12 and purchase 100 (50) points farther OTM for puts (calls).
- Exit at 80% capture, when down 2x that amount, or with 7 DTE: whichever comes first.
- Trade and monitor 15 minutes before regular market close every trading day.
This trade begins 1/4/21 (74 DTE) down $336. MR is $18,036 (two contracts), PT is 1964 * 0.8 = 1572, and ML = 3144.
At trade inception, TD = 46, IV 21.31, NPD = -0.69, and NPV = -239.72.
On 3/4/21 (59 DIT), this trade closed for ROI of 9.1% with market up 0.19 SD. IV increased 17.5% over the following:
Chalk up one for the good guys. Remember though, the focus here is on developing “muscle memory.” To that end, losses must be welcomed as they are a reality of trading.
Categories: Option Trading | Comments (0) | PermalinkCall Me Crazy (Part 8)
Posted by Mark on July 8, 2021 at 07:36 | Last modified: May 27, 2021 10:50Last time, I discussed the risks of a multi-year down or flattish market on the long call (LC) strategy. Today I want to start wrapping up some loose ends in preparation to move on.
Many variants can be made to what is just one of many LC backtest permutations:
- Vary DTE from two years
- Vary DIT from one year
- Apply price-based (i.e. market up/down X%) rather than time-based roll
- Vary strike from ATM (i.e. ITM, OTM)
In Part 7, I discussed how the LC can realize serial losses by rolling down to the current ATM strike in a multi-period down/flattish market. Holding the strike avoids replenishment of juicy extrinsic value that dissipates quickly on a continued move lower. Some people would say the stock market’s long-term upward bias makes this a lower-probability trade. My gut reminds me this upward bias is not written in stone or guaranteed by law. The Nikkei has gone over 30 years since hitting all-time highs. Can you imagine this happening to US stocks? I feel the need to consider it in order to be prepared.
A trend-following (TF) technique could take advantage of a sustained move lower. Maybe I hold the strike and do not roll down when price is below the 200-MA. Although this seems logical, keep in mind we have no data to suggest it actually works. In fact, I have data to the contrary from testing a variant of this as a short entry for /ES:

As much as it twists my innards, sticking with the long bias and is probably best until and unless I have reason to someday think otherwise (and if this happens, then hopefully I’ll have capital left when I finally make the decision to switch). Did someone say hope is not a strategy?
Thinking about the damage from a long-term bear market is to say the LC strategy has no built-in TF downside component. Oh well. One of two resilient [expectancy, not necessarily risk-adjusted] edges I have found is the upside for equities.
A volatility filter to add or substitute more downside protection sounds logical to monetize a down market. In this case, maybe something OTM would work better because despite the built-in insurance, the LC cost can really hurt. Maybe even selling the stock and going put-only would help—or some sort of put spread to offset the higher volatility and time decay.
Similar to the TF filter explored above, the problem with this idea is that going long on VIX spikes historically performs well. While a volatility filter might keep me alive should equities not bounce back, I think (versus my gut) I’d rather play the percentages than bet on something never-before experienced. Much of investing seems to come down to this.
I will continue next time.
Categories: Option Trading | Comments (0) | PermalinkCall Me Crazy (Part 7)
Posted by Mark on June 24, 2021 at 07:43 | Last modified: May 31, 2021 11:02Last time, I discussed the risk to long calls (LC) posed by flat/down years on the stock market. Today I want to turn up the volume a bit by considering multi-year weak markets.
A multi-year bear market is one of my greatest fears because LC loss will be additive from one year to the next. Part 6 includes a table where I isolate the down and flattish years from my 14+ year backtest. Only in 2007-2008 do we see back-to-back down/flattish years. This does not hurt the LC account very much because 2007 ends roughly unchanged. Only when I add March 9, 2009, as part of the enhanced data set do we see the 32.8% drawdown shown here. Although 2009 doesn’t end at that level, we begin to get a sense of the toll taken from consecutive down periods.
A market that declines over a series of years could result in major losses. Let’s look at Tokyo’s Nikkei index. Japan experienced a deflationary recession from ~1990 through at least 2011 where share and property price bubbles burst:
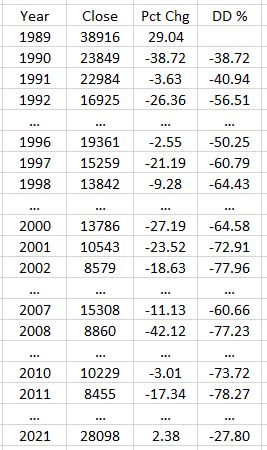
In a 12-year span, we see three instances of back-to-back-to-back down years. I can imagine a LC account down 20% in 1990, down 7% in 1991, and down another 20% in 1992 for a total hit of ~45-50%. This is an improvement over the underlying shares but still major damage. While the Nikkei average rebounds roughly 13% over the next three years, I can then imagine the LC account down 5% in 1996, 15% in 1997, and 13% in 1998 leaving it only marginally ahead of the underlying shares. Conservatively estimating a 10% each decline for 2000-2002, the LC account would pretty much go bust (worse than the underlying shares) were I not to make any changes to the trading strategy over all this time.
The “lost decade” for our beloved SPX perils in comparison to what Japan has experienced. From the end of 2000 through the end of 2010, SPX lost 4.7%. Looking closer reveals something much tamer than the Nikkei with only four down years and five consecutive up years (2003-2007) during this period that dealt US investors so much pain.
Zooming out, since 1928 the SPX has had some rockier periods:
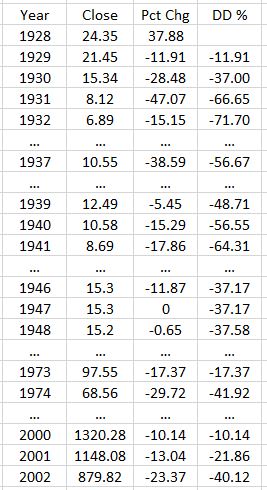
The last row will change through the end of this year. The value shown is from May.
1929-1932 is the only instance I can find of four consecutive down years on a stock market. I can easily imagine a LC account losing 60% during this span. While this might outperform underlying shares, it is catastrophic loss nonetheless. The table also shows other cases of back-to-back-to-back down/flattish years that would really hurt a LC account invested as prescribed.
After looking at these data, I am tempted to wonder whether the last 20 years (including the entire LC backtest) hasn’t been a remarkable gift. I often hear people predicating investment theses on things like “the stock market has an upward bias,” or “the market has always taken out new highs and will continue to do so.” I don’t think it has to be this way, I sure as heck don’t think it always will, and when the next bear market sticks around for more than what amounts to a flash in the pan (COVID-19 scare in Feb-Apr 2020), I need to be be sure that my trading strategy can withstand it.
Categories: Option Trading | Comments (0) | PermalinkCall Me Crazy (Part 5)
Posted by Mark on June 18, 2021 at 07:11 | Last modified: May 20, 2021 10:36I want to continue discussing the long call backtest by understanding what it means to trade with insurance.
Trading with insurance has a few different interpretations. The long call is synthetically equivalent to underlying shares plus a long put (also known as a “married put”). Puts are commonly recognized as insurance, which few people purchase. The long call represents insurance because it controls stock shares for a fraction of the cost. These are two sides of the same coin.
Deleveraging limits loss. In the backtest (see table here), long calls return almost as much as the underlying stock shares for a much lower cost. The capital used to buy the call is the only portion of the account I can lose so long as the call is in play.
Deleveraging complicates performance comparison. Depending on reference, the long-term average stock return is about 8% (1957 – 2018 for SPX). I think many people come to believe they need 8% annually to keep pace with the market. This benchmark, however, implies a 100% stock portfolio. Who does that? A blended (deleveraged) portfolio with 60% stock returning 10% and 40% bonds returning 1.4% (average 3-month T-bill APY over last 20 years) generates an overall return of (10 * 0.6) + (1.4 * 0.4) = 6.56%. I believe many people would be unhappy, thinking this falls short of the 8% benchmark.
Given that mentality, beating the market is an incredibly difficult task. Stocks in the blended portfolio need to return 12.4% annualized to match the headline average stock return! Rumor has it most self-directed and active investors fail over the long-term. An apples-to-oranges comparison of a blended portfolio with a pure benchmark may be one reason why: people investing with greater risk in search of better returns ending up suffering outsized loss.
Those who can’t at least match the benchmarks are told to “dump it all into index funds” or “leave it to the professionals.” Regardless of what assets are included in the portfolio, the appropriate weighted average benchmark should always be used when evaluating returns. Maybe with reasonable expectations, self-directed investors would fare better.
I think significant deleveraging coupled with long-call implementation should somehow make its way into performance metrics. The call is most expensive in Jan 2009 at less than 17% of the underlying index. In 2008, the call loses no more than its then-maximum limit of 20% for the year. The long shares lose much more and could bankrupt the account on any given day. This limited exposure allows investors to sleep well at night. One way to account for this apparent safety is what I called in Part 2 “RAR by MPDD:” CAGR divided by % exposure. This is how I came up with 6.6 vs. 1.1 in favor of long calls.
Might this safety be an illusion? I will discuss that next time.
Categories: Option Trading | Comments (0) | PermalinkBrokerage Perspective on Freeriding vs. Good Faith Funding Violations
Posted by Mark on May 18, 2021 at 07:20 | Last modified: April 23, 2021 10:37Today I will discuss freeriding and good faith funding violations.
I contacted TD Ameritrade (TDA) about the specific example described at the end of my last post and they said it would not be an issue. I would receive an e-mail over the weekend telling me the shares had been assigned and that I need to take immediate action to cover the position. I am clear provided I do this near the open on Monday morning. If I delay, then TDA has the right to apply discretion on a case-by-case basis. In so doing, they will make every effort to do what’s best for my account value and the brokerage.
Before I explain the brokerage perspective, I want to reference the SEC website with regard to “freeriding.” According to the SEC website, I am allowed to use unsettled funds to make a subsequent transaction in a cash account but I must wait until the initial funds settle before offsetting the subsequent transaction. Failure to do so is called freeriding. Covering the short with $191,000 of unsettled funds (recall that the account previously contained $100,000) is okay but continuing to trade with those funds before the $291,000 settles is not.
Freeriding is a violation of the Federal Reserve Board’s Regulation T, and brokers/dealers must suspend or restrict cash accounts for 90 days as a penalty. This shouldn’t be an issue with margin accounts because the funds may be borrowed until settlement clears. If a cash account is restricted, then securities may only be purchased using settled funds. Equity (option) transactions are settled two (one) business day after the transaction date.
TD Ameritrade makes a distinction between freeriding and a good faith violation. Here is an example of the latter:
- On Monday, I hold ABC stock.
- On Tuesday I sell ABC stock, which will settle on Thursday (two business days later).
- On Wednesday morning, I buy XYZ stock.
- On Wednesday afternoon, I sell XYZ stock for a profit.
My Wednesday morning purchase was done on good faith that the sale of ABC would settle thereby making the funds available. I am in violation because I did not wait for the ABC settlement before selling XYZ stock, which means I never fully paid for XYZ. For this, I would receive an e-mail explaining the violation. If I am in violation three times within 12 months, then my account will be restricted to using only settled funds for 90 days.
TDA regards freeriding as a situation where funds are never in the account. An example of this could involve a failed incoming ACH transfer. While ACH transactions may take up to two business days to settle, TDA makes the funds available immediately for marginable stock above $5 on a listed exchange (not options). Suppose that on the day I open a new account with a $25,000 ACH transfer, I buy $25,000 of QRS stock and sell later that afternoon for a 100% profit. If the $25,000 deposit never goes through, then I have committed a freeriding violation and profits will be seized.
In speaking with TDA, my confusion between freeriding and a good faith violation may be explained by limited margin they grant to retirement accounts. Margin is pledging securities as collateral for a brokerage loan. Accounts given tax-deferred (traditional IRA) or tax-exempt (Roth IRA) status are prohibited from accepting such loans and may lose their favorable tax status for doing so. The limited margin applied here is the ability to use unsettled funds for subsequent trades—not to provide leverage, but rather to prevent trip-ups resulting from specific, temporal oversights.
Categories: Option Trading | Comments (0) | PermalinkPotential Tax Implications and Settlement Issues
Posted by Mark on May 13, 2021 at 06:54 | Last modified: April 23, 2021 10:14Before I go into the second part of this investment approach, I want to address tax considerations and discuss some details about option assignment and settlement.
Please keep in mind the following disclaimer: I am not a tax professional and while the following holds true for me, your personal situation may differ.
If a long-term long call is substituted for the married put, then favorable tax treatment may be available if done with cash-settled SPX options rather than SPY. The underlying index (SPX) cannot be purchased, so the synthetic equivalent must be used in lieu of the married put. I have read—but not confirmed—that some brokerages allow for cross-margining between SPY shares and SPX options. I wonder if said brokerages would cross-margin with other S&P 500 ETFs as well (e.g. IVV)?
Because I am not a tax specialist, I will quickly go over tax implications even though this deserves much more space. Options held longer than one year qualify for long-term capital gains (LTCG) treatment. The SPY ETF qualifies for LTCG treatment if held for more than one year (with the goal being to presumably hold and defer tax payment indefinitely). As suggested above, “favorable” means profit/loss on SPX options gets split into 60% LTCG and 40% short-term capital gains regardless of holding period. Holding for longer than one year would be ill-advised because I would still have to pay 40% short-term capital gains taxes on what would otherwise qualify as 100% LTCG (e.g. SPY options).
Assignment of shares can be a problem for retirement accounts. Consider what happens if I sell 10 Jul 300/290 bear call spreads on SPY for $3.00 each in my $100,000 IRA account. The most I can lose appears to be 10 * $100/contract * 10 contracts = $10,000, which is 10% of the initial account value. At expiration, suppose SPY trades at $291. I will be assigned on the short 290 calls forcing me to sell 1000 shares for $290,000. Because short positions are not allowed in IRAs, the position must be covered immediately. At Monday’s open, suppose I buy to cover for $291/share (assuming no price change from the close, which is not very realistic). I lose $1,000 of the $3,000 initially credited at trade inception on the assignment/cover, bank the profit, and move on.
“Not so fast, my friend.”
Being assigned on the short 290 calls brings 290 * $100/contract * 10 contracts = $290,000 into my account, but trades are not settled until two business days after execution. Being an IRA account, I must cover the short immediately with $291,000, which I do not have currently available since the sale has not yet settled.
Is this a problem?
I will discuss next time.
Categories: Option Trading | Comments (0) | PermalinkNot Exactly a Cash Replacement Strategy (Part 2)
Posted by Mark on May 10, 2021 at 07:06 | Last modified: April 20, 2021 09:49Today I continue study of what I am calling not exactly a cash-replacement strategy: the first component of a new (to me) investing approach.
This component is not exactly a cash-replacement strategy because it carries more risk than cash, which can really only lose to inflation. Backtesting will help to put context around “more risk,” but max loss being realized over a string of consecutive years would severely damage core equity. If I deem the potential for adverse performance to be limited, then I may choose to use this as a cash replacement.
I can think of a few potential variants with the first being leveraging up leftover cash. In the example I gave last time, on a $247 investment my max risk is less than $20 (not counting dividends) for the year. Why not double to 200 shares and buy two puts? My max risk would then be less than $40, which is just under 17%, and my potential profit (unlimited) would increase twice as fast. The downside is that losses start to accrue with anything less than a $20 (per 100 shares) gain by expiration.* I am interested to look at the historical distribution of returns to get an idea of the probabilities.
A second potential variant to the married put cash replacement is resetting the long put ATM to lock in gains once the market rallies X%. This would cost more money although if months have passed, then I can seize the opportunity to roll the put out in time, which would eventually have to be done anyway.* I think backtesting this entire approach will have to be some sort of horizontal (by date) summation of components. For this variant, separate backtesting of the put involves exit after an X% gain in the underlying (for a loss) or exit with Y months to expiration (for a gain or loss): whichever comes first.
A third variant to the married put cash replacement is to buy a put debit spread for limited downside protection if VIX > Z. This would limit cost of insurance at the risk of losing more overall if the market decline continues thereby forcing an early exit (e.g. at the long strike?). From a backtesting perspective, this would be challenging because not only do I have to backtest across a range of Z, I should also backtest across a range of vertical spread widths (or debit spread prices).
A married put is synthetically equivalent to a long call, which suggests as a fourth variant purchase of a long-dated ATM call alone. With one leg instead of two, this might be an easier trade (unless I were to hold SPY shares and only move around the long put, which would nullify the simplicity advantage). Done this way, I should invest the remainder in T-bills or some other cash proxy unless I intend to leverage up as described three paragraphs above.
I will continue next time.
* — My intent will not be to hold to expiration due to accelerated time decay in the final months.
Not Exactly a Cash Replacement Strategy (Part 1)
Posted by Mark on May 7, 2021 at 06:53 | Last modified: April 19, 2021 17:18Today I will talk about the first component to a hedged approach to option trading.
A cash replacement is relatively safe. Cash is savings accounts, money market accounts, certificates of deposit, FDIC insured, etc. Cash suffers from inflation risk: it will be devalued over time if the interest rate (currently near zero) is less than the rate of inflation, which is generally not the case (see below). A cash replacement will not be government insured, but it should have comparable risk in terms of how much it may lose in any given year.
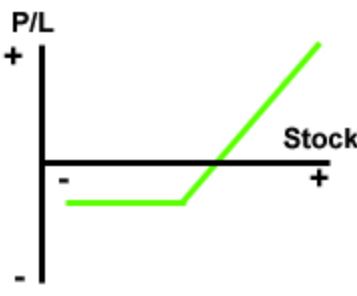
The first component in the proposed hedged portfolio approach is a married put. This is a long-term ATM put and 100 shares of underlying stock. The maximum potential loss is the total cost of the put. If the market is lower at expiration, then the loss incurred by the shares is offset by intrinsic value of the long put. If the market is higher at expiration, then the cost of the put subtracts from gains in the shares. The risk graph is shown below:
Before I can assess a potential cash replacement, I need to understand the historical annualized return on cash. According to Portfolio Visualizer, using Vanguard Short-Term Treasury Fund Investor Shares (VFISX) as a proxy for cash reveals an average CAGR of 3.75% (1.48% after inflation) from Jan 1992 through Mar 2021. The range is -0.57% to 12.11% with a standard deviation of 1.91%.*
Next, I need to run a backtest to get a comparable performance distribution for the married put. The shares will benefit from the annual dividend to discount the put cost, which is ~2% in recent decades.
Always implied when we see benchmark returns is that 100% of the account is invested. Few people really do that. The long-time rule of thumb, which I am not advocating, has been to invest in equities a percentage equal to “100 minus your age.” In a pinch, a “conservative” asset allocation often preached is 60% stocks + 40% bonds. Either way, whatever the equities return in any given period must be diluted accordingly to calculate total portfolio return.
If I believe the married put to be sufficiently safe, then I can use it as a repository for cash in the account and avoid deleveraging the portfolio as just described. Committing 100% of my investible assets to an approach like this would immediately give me a 4% (or more) advantage per 10% CAGR according to the traditional approaches mentioned above. That’s a huge head start.
While I will be interested to see the overall return of the married put, in theory the total cost seems more reasonable in periods of low volatility than high. In the latter portion of 2017 with SPY around $247, a 2-year ATM put could be purchased for about $20. The dividend yield was about 2% so the annual cost of this insurance was about 2.1% (rounding up).
Would I risk putting my remaining assets in a vehicle that could lose no more than 2.1%? Inflation has averaged 1.2% over the last 12 months, which means cash has returned roughly -1.0%. Losing 1% is not much better than losing 2.1%, perhaps, although with implied volatility currently higher maybe the potential loss is also higher—either way, if my answer is ultimately yes then this could adequately serve the purpose of cash replacement.
I will continue next time.
* — As an aside, correlation to US equities is -0.19.
Hot Take: Insurance is Overpriced
Posted by Mark on October 26, 2020 at 07:01 | Last modified: January 9, 2021 15:48I’ve been getting more organized this year by converting incomplete drafts into finished blog posts. Given the stock market crash Q1 of this year, here is a timely piece from October 2019.
—————————
In any industry, insurance is overpriced. How do we know? Because insurance is known as a great business to be in (ask Warren Buffett). Whether or not they realize it, people have difficulty pricing the value of protecting against huge loss. As a result, they tend to overpay. Insurance gets dismissed as just another bill to pay.
With regard to cars, houses, and medical (until recently), insurance is a legal requirement. Such demand probably maintains or drives the price of insurance higher.
What if people were required to buy insurance for their stock investments? Some believe put insurance to be chronically overpriced. If people had to buy then the IV would presumably be even higher, which would be edge to the sellers. Why isn’t this the case? Only people with dispensable income (savings to invest) get involved in the stock market in the first place. This amounts to a relatively small proportion of people compared to the proportion of those with cars, homes, or medical needs.
I assume that the “smart money” such as pension funds, hedge funds, and institutional fund owners are those who predominantly buy put protection to keep the IV inflated. What a boon to business it would be if it ever came to pass that everyone had to buy!
Maybe it’s not such a bad idea to be like the “smart money” and buy the protection anyway.
Some strongly argue for this NOT to be the case. And if you have the extra money to lose, which synthetically takes the form of trading small, having lots of cash on the sidelines, and/or being relatively deleveraged, then it’s probably best not to buy the insurance at all and collect interest on those payments rather than seeing them go down the drain in the first place.
Categories: Option Trading | Comments (0) | Permalink