HSA Strategy (Part 3)
Posted by Mark on August 22, 2025 at 07:07 | Last modified: February 27, 2026 09:59Today I plan to wind up discussion of Health Savings Accounts (HSA) prior to deliberation over how to manage my own. Please remember this is for educational purposes only.
I see several good reasons to have an HSA for those fitting the suitability profile described in the fifth paragraph here. HSAs allow for delayed reimbursement: pay now, save the receipts, and reimburse oneself in the future thereby allowing more time for tax-free growth. Although contributions are out-of-pocket funds that could otherwise be used elsewhere, the bulleted list here for what does qualify is extensive. Odds are one will find plenty on which to spend HSA funds unless precluded by sudden death at a relatively young age.
Most HSA providers allow investment in stocks, mutual funds, or ETFs once a minimum threshold (ranging from $2,000 down to $0) is reached.
A final benefit to having an HSA is its function as a retirement hedge. Flexible spending accounts [owned by employer] carry “use-it-or-lose-it” [most commonly by year-end or final day of employment] risk. HSA funds belong to the individual, never expire, will roll over at year-end, and will remain after job change or retirement. HSAs also have a built-in safety net should one reach retirement with a large balance: opportunity to use the funds for non-qualified healthcare expenses while still being taxed like a traditional IRA (advantaged at tax-deferred just not as advantageous as tax-free). Another retirement hedge is the triple tax advantage (see numbered list) making HSAs widely considered to be the most tax-efficient retirement vehicle available in the United States. Finally, HSAs hedge against outliving other retirement assets by having no required minimum distributions (and tax-free passage after death to surviving spouse).
In thinking about the HSA as a tool to cover personal health expenses forevermore, I wondered how big an HSA could possibly get or how much they are worth on average.
Per GoogleAI, the average HSA balance rose to approximately $3,997 by mid-2025 with total HSA assets reaching ~$159 billion across 40 million accounts. Specific providers like Lively report higher average balances of $5,457 (up 11% YOY) for their clients. Accounts with invested funds average $22,635—roughly nine times larger than non-investment accounts.
For 2026, average HSA balances are projected to reach $4,400 with total HSA assets rising to $189 billion on 44 million accounts. About 20% of participants (up from 18%) are expected to have invested funds.
IRS sets the maximum allowable contribution for each year. In 2025, these are $4,300 or $8,550 for individuals or families, respectively. Those turning 55 by Dec 31 can contribute an additional $1,000 (“catch-up”). Allowable 2026 contributions for individuals or families increase to $4,400 or $8,750, respectively, with catch-up remaining the same.
I will continue next time with HSA investment planning.
Categories: Accountability, Financial Literacy | Comments (1) | PermalinkHSA Strategy (Part 2)
Posted by Mark on August 19, 2025 at 07:43 | Last modified: February 24, 2026 16:39Today I continue with my discussion of Health Savings Accounts (HSA) before moving on to decide how I will invest mine.
This is for educational purposes only. Please see the full disclaimer in the second paragraph here.
As previously mentioned, HSA eligibility requirements start with high-deductible health [insurance] plan (HDHPs). These are characterized by lower monthly premiums and higher annual deductibles than traditional plans. For 2026, the IRS defines HDHPs as plans with a minimum deductible of $1,700 for individuals and $3,400 for families (more on this below). With HDHPs, one usually pays the full cost of most medical services out of pocket until the annual deductible is reached at which point copays or coinsurance apply. Monthly premiums are often less than standard PPOs or HMOs. In-network preventive services (e.g. annual physicals or vaccines) are usually covered 100% even before meeting the deductible.
HDHPs must also adhere to maximum out-of-pocket limits. For 2026, this is $8,500 ($17,000) for individuals (families). Anything higher is viewed by IRS as “too expensive” for the consumer and does not qualify for tax advantages of an HSA.
Some people are better suited to HDHPs. Mostly healthy individuals with few doctor visits aiming to save on monthly costs are ideal. HDHPs are not such a good fit for those with chronic conditions or people requiring frequent specialist visits and prescriptions since upfront costs can be high. HDHPs attract savers who want to use HSAs as long-term, tax-advantaged investment tools for future healthcare needs in addition to those with a financial cushion who can afford to pay greater deductibles in cases of emergency.
Perhaps because I’ve grown accustomed, I did not think $1,700 (individual) to be “high deductible.” It actually is. Employer-sponsored plans average $1,400 for an individual PPO deductible while many zero-deductible HMOs and high-tier PPOs also exist (copay-only for most services from day one). For individual Marketplace insurance, gold plan deductibles average ~$1,500 while platinum plans have zero or very low deductibles often averaging < $100.
Aside from the HDHP, other eligibility criteria for HSA contribution include:
- No other medical coverage (e.g. traditional PPO or a spouse’s non-HDHP) though dental and vision plans are allowed.
- Not enrolled in Medicare Part A or B.
- Not a dependent claimed on someone else’s tax return.
HSA parameters vary by year. For 2026 (2025), individual contribution limit is $4,400 ($4,300) and minimum HDHP deductible is $1,700 ($1,650). “Catch-up” contribution allowed for ages 55+ (on or before Dec 31) is additional $1,000 for both years.
I will continue next time.
Categories: Financial Literacy | Comments (1) | PermalinkHSA Strategy (Part 1)
Posted by Mark on August 14, 2025 at 06:57 | Last modified: February 24, 2026 12:22As mentioned in the second paragraph here, today I will begin discussing Health Savings Accounts (HSA) with the goal being how to invest mine.
Here is a legal disclaimer for the current blog mini-series.* This is not professional advice and not intended to replace the advice of a tax advisor or attorney. HSA contributions, distributions, and eligibility are IRS-governed and subject to change. As the account holder, you are responsible for verifying eligibility, tracking transactions, and complying with IRS regulations. While some HSA funds are FDIC-insured, investment options are not bank-guaranteed and may lose value. Information provided here is [mostly] accurate at time of writing but subject to change based on new legislation or IRS guidance.
Given that disclaimer, let me define HSAs as tax-advantaged personal savings accounts for individuals enrolled in high-deductible health [insurance] plans (HDHP).
HSAs offer the triple tax advantage:
- Tax-deductible contributions lower taxable income by corresponding amount.
- Tax-free growth means interest or capital gains on investment are not taxed [unlike tax-deferred 401(k) earnings].
- Tax-free withdrawals means proceeds used to pay for qualified medical expenses are not taxed.
Upon turning 65 years of age, HSA funds may be withdrawn for purposes other than qualified medical expenses but taxed as regular income [like the 401(k)]. If used for purposes other than qualified medical expenses prior to age 65, then HSA funds are taxed as regular income and subject to a 20% penalty.
Qualified medical expenses (always keep receipts as documentation) are rather extensive:
- Medical services including ambulance services, doctor visits, hospital stays, laboratory fees, surgery, and X-rays.
- Dental and vision services including braces, cleanings, contact lenses, dentures, eyeglasses, fillings, and LASIK.
- Prescriptions and OTC (no prescription required) products including acne treatment, insulin, and menstrual products.
- Equipment and supplies such as bandages, blood sugar test kits, breast pumps, crutches, hearing aids, and masks.
- Acupuncture, addiction treatment, chiropractic care, physical therapy, psychiatric care, and smoking cessation programs.
- Capital expenses to accommodate disabilities (e.g. grasp bars, railings, and ramps).
- Costs for [primarily] medical-care transportation and related travel (i.e. mileage, tolls, parking, bus/airfare).
- Doctor-recommended special education (e.g. tutoring for children with learning disabilities due to mental impairment).
- Medicare (ages 65+) premiums (A-D) [can no longer contribute once Medicare-enrolled but may spend existing balance].
- Premiums paid for COBRA [medical, dental, and vision] continuation coverage if job lost to a qualifying event.
- Premiums paid while receiving federal or state unemployment compensation.
- Premiums paid for qualified long-term care insurance subject to age-based caps on annual tax-free withdrawal amount.
I will continue next time.
* — In case my buddy Marc (with a “c”) is out there reading
Investing in T-bills (Part 17)
Posted by Mark on March 23, 2024 at 08:51 | Last modified: April 10, 2024 09:26Higher initial/maintenance margin requirements is one reason why option traders may choose [taxable] T-bills [interest] over tax-exempt munis. Another reason to favor T-bills is the muni bond de minimis rule.
I want to clarify interest on zero-coupon T-bills as discussed in the third-to-last full paragraph of Part 16. These are taxed as if interest income were being received even though no income is actually received until the bond matures. Whether price appreciation to par or a semi-annual coupon payment, both are taxable interest as far as Uncle Sam is concerned.
As far as munis (issued by state, city, and local governments) go, interest is generally free from federal taxes and is:
- Usually free from state tax in the state of issuance.
- Not taxed by some states regardless of the state of issuance.
- Sometimes exempt from state tax at the time of issuance by that same state even when said state usually taxes them.
Unlike muni interest, bond price appreciation is usually taxed in accordance with the de minimis rule. At issue is whether price appreciation will be taxed as ordinary income or as capital gains. This is done as follows:
- Multiply the face value by 0.25%.
- Multiply that result by number of full years between bond purchase and maturity date to get de minimis discount.
- Subtract de minimis discount from muni par value to get the minimum purchase price.
- If actual purchase price is less (equal to or greater) than the minimum purchase price, price appreciation on the bond is subject to ordinary income (capital gains) tax rates.
For example, imagine $97.75 purchase of 10-year muni paying 4.00% APY with par value of $99 and six years until maturity.
De minimis discount = $99 x (0.25% / 100) x 6 = $1.485
Minimum purchase price = $99 – $1.485 = $97.515
Because $97.75 > $97.515, price appreciation will be taxed as capital gains. If held for over one year (one year or less), then capital gains tax rates are lower than (equal to) ordinary income tax rates.
The de minimis risk [of having to pay ordinary tax rates on price appreciation] is greater in rising interest rate environments. Since interest rates are inversely proportional to bond prices, increasing rates are associated with decreased bond prices.
One case where price appreciation may be tax-exempt is a zero-coupon municipal bond. These are always bought at a discount since they make no interest/coupon payments and price appreciation to par value is usually not taxed. The biggest caveat seems to be selling before the maturity date. In this instance, any price change realized on zero-coupon munis will be treated as a [short- or long-term depending on holding period] capital gain or loss.
Is that light at the end of the tunnel I see?
I will continue next time.
* — The Part 11 disclaimer applies: please consult a tax advisor for the definitive word on these matters.
Investing in T-bills (Part 16)
Posted by Mark on March 22, 2024 at 09:43 | Last modified: April 10, 2024 09:46Last time, I began to explore the idea of trading options on top of tax-exempt munis since interest on T-bills is taxed at the Federal level. Today I continue the discussion with regard to maintenance margin requirements.
Let’s define two new terms: initial margin and maintenance margin. Initial margin is the percent of purchase price that must be paid with cash in a margin account. Maintenance margin, currently set at 25% of the total securities value per Financial Industry Regulatory Authority requirements, is the amount of equity that must be kept in the margin account going forward.
Maintenance margin for equities is best illustrated by a table:
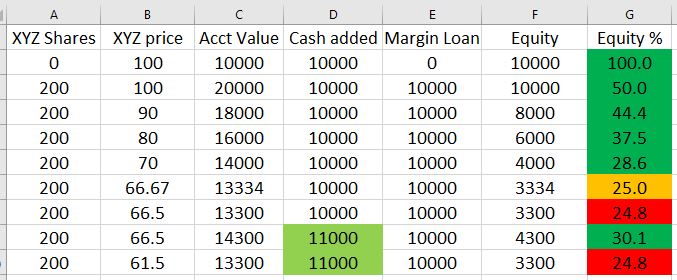
- A margin account is opened by depositing $10,000 (column D).
- Using the $10,000 free cash and $10,000 borrowed from the brokerage (column E), 200 shares of XYZ are purchased at $100/share causing an equity percentage [col G = 100 * (col C – col E) / col C] drop to 50%.
- Equity percentage drops further as the share price drops.
- When XYZ hits $66.67/share, equity percentage is at the minimal threshold of 25%.
- At $66.50/share (a drop of 33.5% from initial purchase price), equity percentage is below threshold. Brokerage will issue a margin call forcing deposit of more cash or securities to avoid sale of XYZ at a big loss.
- Depositing an additional $1,000 (now $11,000 total in column D) restores equity percentage (30.1%) above the minimum threshold where it will remain unless XYZ drops to $61.50/share resulting in a subsequent margin call.
Although taxable, T-bill interest qualifies for 1% initial and maintenance margin for maturities up to six months. This means $100,000 of T-bills may be purchased while preserving $99,000 for option trading. Beware, though! This defines how much capital may be borrowed rather than how much should be invested. As stated in this third paragraph, capital should never be borrowed to invest in T-bills. T-bill investments count 100% against the cash balance* and margin loans begin if cash balance drops below zero (hence the 10% cash buffer mentioned in this second-to-last paragraph).
For the sake of option trading, low maintenance T-bill margin seems like a great deal that is actually just a necessary precaution (see bottom of Part 8) to prevent the brokerage from pocketing additional interest. While the customer gets paid 0.35% on free cash, the brokerage could invest that cash in T-bills to make 5% or more. I need to do more research to determine if this actually happens, but it seems plausible since T-bills are about as safe as any investment can get.
Disadvantaged margining for munis likely offsets their tax-exempt benefit. At my brokerage, initial and maintenance margin are the greater of 20% of the market value or 7% of the face value. I see another brokerage listing maintenance margin at 25% of bond market value (and initial at maintenance margin x 1.25). Either way, munis eat up at least 20x more in buying power than T-bills making them more likely to hamper option trading.
Next time we will study de minimis.
* — In contrast to naked puts that, as discussed in this last full paragraph, raise cash balance.
Investing in T-bills (Part 15)
Posted by Mark on March 20, 2024 at 09:41 | Last modified: April 7, 2024 10:46The meandering mini-series continues with some further comments about taxes and municipal bonds.
As a sidebar to what seems like a series of sidebars, meandering is not a bad thing with these blog posts. What ends up presenting is the opportunity to touch on a number of related subjects. Researching and writing about these topics helps me learn. Hopefully you can gain something too in the form of some well-rounded financial understanding.
Because T-bills (along with all Treasury bonds) are subject to Federal tax [exempt from state and local taxes], I often see the recommendation to hold them in tax-advantaged retirement accounts such as traditional or Roth IRAs. Traditional IRAs owe tax on bond interest only when funds are distributed (withdrawn) rather than as interest is earned. This allows for longer compounding. Roth IRA contributions are fully taxed up front allowing bond interest to be effectively tax-exempt.
Retirement accounts must be cash accounts. Cash accounts are not eligible for margin loans from the brokerage (“trading on margin”). Neither are cash accounts subject to initial and maintenance margin requirements* that enable certain types of option trading such as call writes and short puts.
To me, the cash-versus-margin-account delineation clarifies the bond recommendation from above. Fixed income (i.e. T-bills or other bonds) may be managed as one asset in a diversified portfolio (e.g. an allocation made up of 50% large-cap stocks, 20% small-cap stocks, and 30% fixed income) for which a cash account like an IRA is perfectly suitable. If using T-bills to maximize return on cash left over from option trades, however, then T-bills and options must be in the same account: likely a [option-enabled] margin account rather than an IRA (cash account). The above recommendation would not apply.
With tax on T-bill interest weakening the case for trading synthetic long stock + T-bills in lieu of long shares,** municipal bonds come to mind. “Munis” (municipal bonds) are tax-exempt. They are generally a better choice for higher tax brackets because the amount saved by not owing tax on bond interest taxed is greater. When comparing munis with other bonds, a “tax-equivalent yield” (TEV) is often calculated: TEV = muni yield / (1 – marginal tax rate***).
Given the T-bill from Part 12 paying 5.355% YTM, would a muni paying a 3.8% coupon be a better choice? Assuming a 24% tax bracket (marginal tax rate), the muni:
TEV = 3.800% / (1 – (24 / 100)) = 5.000%
All else remaining equal, in this case T-bill is the better way to go.
I will continue next time.
* — To be addressed later
** — Recall this comparison was the real purpose of the entire mini-series. As discussed in
the first paragraph of Part 11, I got my answer early.
*** — Marginal tax rate is the percentage at which my last dollar of taxable income is taxed.
Investing in T-bills (Part 14)
Posted by Mark on March 19, 2024 at 08:58 | Last modified: April 7, 2024 10:46In the fourth paragraph of Part 12, I mentioned creation of a bond (T-bill) ladder without explaining the what or why.
Bond laddering involves buying bonds with different maturity dates thereby enabling the investor to respond relatively quickly to interest rate changes. Investing in bonds maturing on the same date carries high reinvestment risk: being forced to roll over a large capital allocation of maturing bonds into similar fixed-income products with a much lower interest rate. The ladder therefore facilitates a steadier stream of cash flows throughout.
Reducing reinvestment risk and smoothing out interest payments is of limited importance to me since my T-bills mature within months. The Fed usually decides whether to raise/lower interest rates during its eight scheduled meetings per year (and rarely by more than 50 basis points at a time). Over 3-4 months, drastic interest rate changes have seldom been seen. T-notes (T-bonds) mature in 2-10 (20-30) years—periods of time over which large rate changes are more likely.
Limiting price risk is another benefit of bond laddering that doesn’t apply much to my short-dated T-bills. When interest rates rise, bond prices fall; this affects longer-dated more than shorter-dated bonds.* A worst-case scenario would be large portfolio allocation to long-dated bonds at the unexpected start of a rising interest rate environment followed by a catastrophic life emergency forcing bond sale at a substantially lower price to raise cash. Contrast this with an initial outlay of five equal tranches of capital to bonds maturing in 2, 6, 10, 20, and 30 years. The rising interest rates would not hurt the 2-, 6-, and 10-year T-notes nearly as much as the 30-year T-bonds.
One final benefit to bond laddering is liquidity improvement [of a fixed-income portfolio]. Although Treasurys tend to trade on a relatively liquid secondary market, bonds by their nature are not generally liquid investments and cannot be cashed in anytime without penalty. In the example just given, 20% of the total allocation matures after 2, 6, 10, 20, and 30 years making cash available in a relatively short period rather than having to wait 30 years for any (all) of it.
Liquidity improvement is the main reason I use a bond ladder. Should the stock market move sharply against me, I may need cash to close losing positions. Every week I get a cash-balance infusion when T-bills mature. Rather than reinvest, I can skip a T-bill purchase(s) and use the cash to manage option positions. In combination with the 10% cash buffer (see last two full paragraphs of Part 13), I will hopefully avoid having to borrow funds from my brokerage and paying high margin interest.
I will continue next time.
* — Duration is a bond’s change in price per 1% increase in rates.
Investing in T-bills (Part 13)
Posted by Mark on March 11, 2024 at 11:25 | Last modified: April 6, 2024 09:52Last time, I discussed how I invest in zero-coupon T-bills and presented a sample calculation of annual yield. For educational purposes, I will begin today’s post with a similar calculation for a T-bill with coupon.
I have previously invested in couponed T-bills but will no longer be doing so. I recently spoke with a fixed-income representative at my brokerage who told me YTM is calculated a bit differently and for more complexity because coupon payment(s) and accrued interest need to be factored in, the payout ends up being slightly less for numerous couponed T-bills versus zero-coupon T-bills she has compared.
As a sample calculation, consider a T-bill purchased for $99.079 (10X multiplier applies) on Mar 19, 2024, to mature on Aug 31, 2024 (165 days). This was stated to have a 5.357% YTM with $1.766 accrued interest (first coupon Feb 28, 2023) and 3.25% coupon. The 3.25% coupon is semi-annual with each coupon payment half that amount. This bond, therefore, issued coupon payments on Feb 28 and Aug 28, 2023 (or the first business day thereafter if on a weekend), along with Feb 28, 2024. Accrued interest—which gets subtracted since owed to previous bond owner—is from the latter date, and a final coupon payment (Aug 28, 2024) will be issued at [first business day after if on a weekend] maturity:
100% * ((1000.00 – (99.079 * 10)) + (1000 * (3.25 / 100 / 2)) – 1.766) / (1000 * (165 / 365)) = 5.241%
As with the zero-coupon T-bill calculation, this is not an exact match (to 5.357%) but in the ballpark. As a partial explanation, the fixed-income representative told me something about the YTM calculation for couponed T-bills not accounting for accrued interest that must be repaid and is not actually part of the calculation.
I always maintain a cash buffer when investing in T-bills. I hinted at this in the second-to-last paragraph of Part 4 as well as Part 12 where I mention the 90% number. If the market moves against me and a short option need to be bought back for a loss, then my cash balance will go down. If I am consistently buying long options that don’t pay out then cash balance can be depleted as well. As stated in the third paragraphs of Part 2 and Part 3, the last thing I want is for my cash balance to go negative and be forced to borrow brokerage funds because the margin interest rate is over double what I receive on T-bills.
Were I primarily investing in long stock, a cash buffer would be less important. Losing $5,000 on a $20,000 stock position would likely be followed with investment of the remaining $15,000 in a different stock; only if I turned around and invested another $20,000 would I deplete the cash balance. Besides, as mentioned in the fourth paragraph of Part 2, a [predominantly] stock investor will use most free cash for equity investments thereby leaving little left over for T-bills anyway.
I will continue next time.
Categories: Financial Literacy | Comments (0) | PermalinkInvesting in T-bills (Part 12)
Posted by Mark on March 7, 2024 at 08:43 | Last modified: April 6, 2024 09:13As mentioned in the fifth-to-last paragraph of Part 8, if trading options with a lot of free cash in the account then one really must invest that cash in T-bills (or some comparable bond position).
My goal with T-bill investment is to earn a relatively high interest rate as discussed in the second paragraph of Part 2. I do not claim this to be optimized or any sort of “best” approach. It makes sense to me, it fits my risk tolerance, and it accomplishes the goal pretty well. The process is a mechanical one that—as mentioned in the fourth paragraph of Part 2—does require a minimal time commitment (usually up to 10 minutes per week).
See Part 1 for a refresher on T-bills.
I allocate about 90% of my free cash to a bond ladder with 6-10 tranches. Every Tuesday, I use my brokerage platform (secondary market) to filter for Treasurys up to one year to maturity, to sort by yield-to-maturity (YTM), and to find highest YTM with shortest maturity date. I generally target maturities 6-10 weeks out and see YTM proportional to [weeks to] maturity. If I see a higher yield for a much shorter maturity date, then I pounce (it may not be the good deal it seems; I don’t yet know what mitigating factors play into this phenomenon). This may result in multiple tranches maturing on the same day that I can later smooth out by purchasing two tranches maturing one week apart on the same day.
Once I have a CUSIP number for the desired T-bill, I call the brokerage to place the order. Prices quoted over the phone are sometimes [slightly] lower, which means a higher YTM. No additional fee is assessed for placing the order by phone and when I call earlier in the day, I usually get connected within 2-3 minutes.
I present one example of a recently-purchased T-bill for those who may want to do the same to ensure accuracy or investment understanding. On Feb 27, 2024, I purchased a T-bill for $99.202 maturing on Apr 23, 2024, and paying 5.355% YTM. Yield is an annualized number that requires division by fractional holding period (in this case 56 days). Also, a 10X price multiplier is always involved. The calculation is:
100% * (1000.00 – (99.202 * 10)) / (1000 * (56 / 365)) = 5.201%
This is not an exact match but in the ballpark. A fixed-income representative recently told me T-bill YTM calculations factor in TVM. I don’t know exactly how the fudge factor works, but approximate is all I need (and far better than 0.35% or 0.57%).
I will illustrate a T-bill with coupon next time.
Categories: Financial Literacy | Comments (0) | PermalinkWhat Percentage of New Traders Fail? (Part 6)
Posted by Mark on August 6, 2020 at 06:28 | Last modified: May 17, 2020 14:27Today I conclude with excerpts from a 2013 Forex website forum discussion. The initial post, which tries to rebuke traditional wisdom, is Post #1 here. Forum content is unscientific and open to scrutiny. Do your own due diligence and buyer beware.
—————————
• Post #54, Set:
> Trading is just like learning any other skill. The catch
> is that people often learn trading with minimal supervision
> and guidance. This is what discourages most people.
>
> But we can change this around. As trader gets more involved
> and contribute to a community, he will have more
> encouragement to work through the learning curve. Recently,
> I have decided to contribute daily to this forum and I have
> noticed a significant change in my attitude towards trading.
>
> Trading is a business and Henry Ford once said, “a business
> that makes nothing but money is a poor business.”
>
> I really like this forum because of all the great mentors
> available here and I aim to become one myself.
I like the positivity here as opposed to the oft-seen flaming, ego, and negativity I see in trading-related forums. I definitely think we must be selective in what we accept, but I think a general belief that people are good can help the foundation.
• Post #56, Big
> Yes, it is skewed and does not relate to the statement
> that 99%, 95% or [insert here any anecdotal % that you
> extract from your nether orifice here, because no one
> that makes the statement has the figures anyway]…
>
> Let’s assume that we start from day 1 and we’ll use
> 95% because, well, why not!
>
> Year 1: 95% newbies fail 5% succeed
> Year 2: 95% fail 5% succeed, + the 5% that succeeded
> last year are still hanging around because they wouldn’t
> quit when they are profitable.
> Year 3: 95% of newbies fail and the successful 5% of
> newbies join the profitable dudes from year 1 and 2.
>
> Get it? Many of the unsuccessful traders will quit, but
> the successful traders will stay on so the percentage of
> profitable traders grows each year… it is cumulative!
>
> The “profitable” percentage in the brokers’ reports show
> the experienced traders that have been here for years, in
> addition to the small percentage of newbies that have been
> profitable. It will always grow because you don’t quit if
> you are profitable.
>
> Most unprofitable traders, if they do not become
> profitable, will eventually quit so that number is more
> likely to level out.
>
> I’d like to see the yearly figures of newbies after one
> year, two years, three years, etc… because it may take
> several years to become successful. That, and only that,
> would test the validity of the anecdote that 95 – 99% fail.
This is a really good example of how such broker numbers can be skewed to the upside. I also remember back to Post #33 where successful traders having multiple accounts was discussed.
• Post #62, Unk
> The percentage of traders that fail are much higher than
> the statistics show. Of all the traders that show a positive
> equity curve most still fail as the few pennies they
> make won’t even beat a McD wage. If you make some rules
> on what is actually “profitable” e.g. making a living
> off it / competitive salary (with benefits, etc.) than the
> field of successful traders gets much slimmer…
The Brazilian day-trading study agrees with this.
• Post #64, Pip
> The percentages are so high because it’s calculated per
> quarter. It’s not because “winning traders” stack up each
> year: some winning traders quit and many losing traders
> don’t. The chance for having a significant amount of
> winners in a quarter is very large. The fact that these
> numbers are so skewed toward losing is proof that of few
> profitable traders. There’s a very big chance for any loser
> to be profitable over one month or year. So Guy 1 loses
> $2K in three months and Guy 2 wins $1K. Next quarter
> Guy 1 wins $1K in three months and Guy 2 loses $2K.
> Both are losers, yet the statistics say there’s one loser
> and one winner in each quarter.
This seems like another interesting example to illustrate how success statistics may be biased to the upside. Losing traders will have to quit, though, if they lose too much or go bust altogether.
Brokerages certainly have an underlying motive to portray success. If the general public believes many retail traders succeed, then newbies will be more likely to try themselves. The more people trade, the more money brokerages make.
This thread has provided us with lots of good fodder for critical thinking and evaluation.
Categories: Financial Literacy | Comments (0) | Permalink