The Case for Withholding Performance Reports (Part 1)
Posted by Mark on October 2, 2018 at 06:05 | Last modified: September 18, 2018 07:02I am surprised to see myself defending opacity in the financial industry.
One of the things the industry routinely avoids is accurate performance reporting. I did an extensive review on the subject earlier this year. The upshot is that most potential clients fail to demand accountability by demanding such reports, that the opacity is likely self-serving for the industry, and that transparency might lead to compliance issues.
Unlike my shock and awe when doing the research, I found myself at least neutral if not favoring opacity when writing this recent post. More is to be said about performance than just the numbers alone. No matter how my results look, for example, the additional context would be downright scary. Consequently, I would feel more comfortable sharing with those I trust than with complete strangers.*
This concept is indirectly affirmed by S12 E15 of CNBC’s “American Greed.” As part of his fraudulent pitch, Ephren Taylor promised one plaintiff an annual return of 66% on a “riskless investment.” Taylor fits under the “worst-case scenario” umbrella along with Madoff and others profiled on the show. But even on much smaller orders of magnitude, I question whether performance claims are ever trustworthy when compliance is not onboard to ensure accuracy.
Performance is one of the most powerful tools con-artists use to defraud people. Promises of unrealistic returns hit the uneducated in arguably their most vulnerable spot. Fraud runs rampant in this industry where people are literally handing over money [with the hopes of investing but all too often with the result of getting robbed].
Because I never know who I’m dealing with when making new connections, I prefer to keep performance out of the discussion. It might be relevant if presented correctly, but the numbers are misleading often enough to necessitate scrutiny as a means to establish validity. I therefore don’t feel comfortable believing performance claims I hear from others and I don’t think they should either. It’s a cautious and maybe even pessimistic approach but I honestly credit an ability to avoid the lofty sales pitch as one of the keys to surviving 10+ years as a full-time trader.
In contrast to baseless claims, I would believe performance numbers generated from GIPS compliance and verification. This is precisely the sort of expense retail investors do not undertake.
* I will resolve a related contradiction next time.
2017 Performance Evaluation
Posted by Mark on August 31, 2018 at 06:50 | Last modified: September 4, 2018 11:53As I am a proponent of performance reporting, today I discuss my 2017 trading performance (also see here, here, and here).
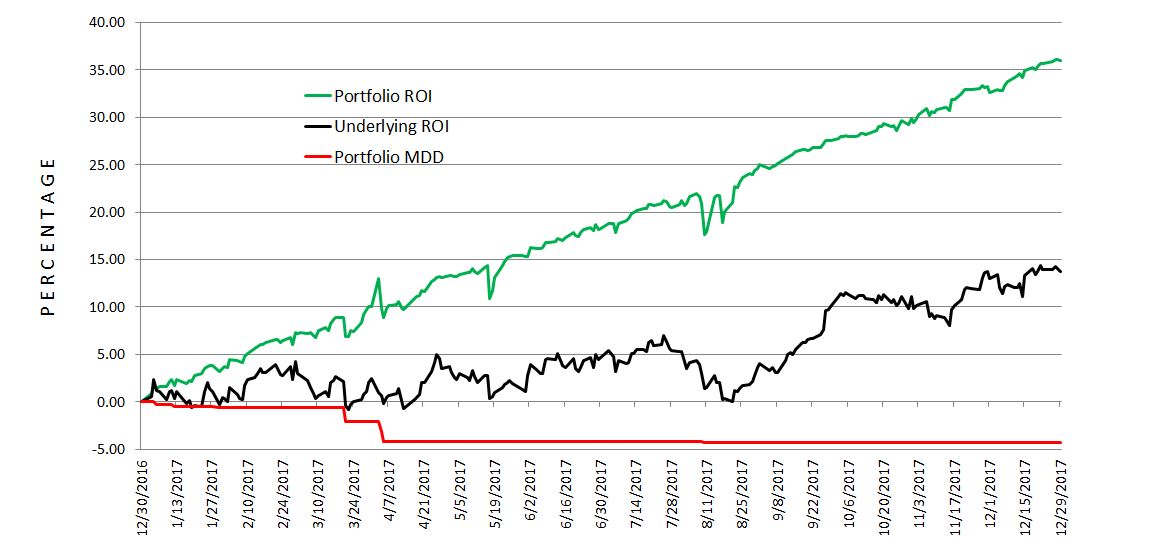
The green and black lines represent performance of my portfolio and the underlying, respectively. The latter is similar to a benchmark for comparison purposes without implementation of constant notional risk. MDD (red line) is maximum drawdown.
I generated +36% versus +14% for the underlying (dividend yield < 2% not included). My MDD was 4.3% versus 6.9% for the underlying, which gives me a risk-adjusted return (DD) 4.2x better. That is smashing. I also like to look at standard deviation (SD) of returns as a measure of risk. My portfolio posted a SD of 0.57, which is about 22% smaller than 0.73 for the underlying. This does not support my conclusion here, which I will soon update for a longer time frame. In the spirit of Sortino vs. Sharpe ratios, I looked at SD of negative returns (losing days) and found my portfolio with 0.60 to be 28% larger than 0.47 for the underlying.
I calculated a Sharpe-style (Sortino-style) ratio of 0.219 (0.208) for my portfolio versus 0.0738 (0.115). These calculations are based on daily returns rather than annualized but I think degree of outperformance is more important.
I also find it noteworthy that my portfolio had 83 losing days, which is ~26% fewer than 113 for the underlying.
Onward and upward, hopefully, for 2018!
Categories: Accountability | Comments (0) | PermalinkWelcome to the Ann Arbor Algos
Posted by Mark on November 2, 2017 at 06:26 | Last modified: August 15, 2017 06:37I wrote this back in April 2012 but it never got finalized. I did post it on Meetup.com without any success. This group concept is different from those discussed here or here because trading system development is the primary focus.
—————————————–
I have seen a number of Michigan investing/trading meetups over the last few years and inevitably, most of them ultimately fail. In some cases, the organizers just gave up. In other cases, the organizers were for-profit entities electing to move in new directions to market their wares.
I am an independent trader in search of other independent traders without any commercial interests. My hope is to form a small group of traders working together to develop trading systems.
This group is for a very specific type of trader. You should:
–Be knowledgeable about trading strategies.
–Understand why a trading strategy does not necessarily make for a trading system.
–Be practiced at critical thinking.
–Have experience working in groups.
–Be willing to purchase AmiBroker (www.amibroker.com) and data as desired.
–Have AFL programming expertise and/or be willing to spend time learning the language.
–Have trading strategies available to be systematically tested by the group.
–Have hours available every trading day for project-related phone calls and e-mails.
–Not think this will be a place to steal profitable ideas without contributing anything of your own.
–Not be looking to enroll our members in your educational company or investing service.
–Have a general understanding of what system development entails.
My hope is to find 3-10 investors/traders to work together on this project. Please contact me if interested or sign up at http://www.meetup.com/Ann-Arbor-Algos/.
Tags: mastermind trading group | Categories: Accountability | Comments (0) | PermalinkRUT Weekly Calendar Trade #15
Posted by Mark on August 4, 2015 at 07:39 | Last modified: August 6, 2015 11:24On July 21, I bought a JulWk5 1255 calendar for $7.37.
With the market trading lower near the expiration breakeven, I rolled half to 1230 on July 24 for a $0.50 debit. This cut NPD from 18 to 3-4.
Less than four hours later, the market was at 1227 so I rolled the other 1255 calendar down to 1235. This was a mistake: I should have rolled to 1230 but it really did not make a difference. I now had a 1235/1230 double calendar to be closed either at 15% loss or if an expiration breakeven was hit.
Shortly after the open on expiration Monday, the market traded under 1213. I closed the double calendar for a max loss of 19.4%.
They say in trading, one has to be able to accept losses. This is now three in a row.
From a few who are now supposedly in their second year doing this trade, I hear it’s not out of the ordinary to have three consecutive losses once or twice per year. I’m trying to give this trade a fair shot so while now bordering on apathetic (not good) with regard to my outlook for this trade, I will keep plugging away.
Categories: Accountability | Comments (0) | PermalinkRUT Weekly Calendar Trade #14 (Part 2)
Posted by Mark on August 3, 2015 at 06:13 | Last modified: August 6, 2015 11:24Today I conclude discussion of weekly trade #14.
Around 11:05 AM ET on expiration Tuesday, the market dropped quickly from 1255.80 to just under 1255. I did not really want to roll the second 1270 calendar to 1255. Because the trade had only 2+ more days and because I might be down over $100 on expiration Tuesday with a max potential profit at expiration of $400 or less (usually closer to $1000 at trade inception), I did not want to roll the other 1270 to 1255. I was guestimating on post-adjustment max potential profit. I find it difficult to model these positions and track the PnL. It was the heat of the moment too.
A couple minutes later, RUT sank below 1253 and I placed an order to close (not roll) the 1270 for $6.70. By 11:10 I had caved $0.50 and still was not filled. I wondered whether I should even be trying to chase at this point because: RUT had breached the lower BB (I’ve really learned this is a bad time to trade but it’s when my emotions run hottest compelling me to trade). Also, I noticed the bid/ask on the calendar was close to $3.60. If I waited then the market would calm down, bid/ask spreads would narrow, and I’d get a better fill. I therefore canceled the trade.
As the market drifted a bit lower, I felt I just had to get the damn thing off. I put in a 4-legged order for the remaining double calendar and caved $0.40 over 2+ minutes. I got filled 0.10 off the then mark for a loss of $74 (4.71%) with the market at 1252.37.
At 10:00 ET on expiration Thursday, the JulWk4 1255 put calendar was trading at 8.40/9.60 at 10:00 ET. By 11:30, it was 9.36/10.27 as of 11:30 ET. I would have gotten the full 10% profit had I rolled the second 1270 calendar to 1255.
Once again, I failed to follow the trading plan. The trading plan says nothing about how I feel about a trade, where the BBs are, how wide the bid/ask is, etc. This time, as previously discussed, what should have been a winner was closed at a loss.
This trade was a big confidence zapper.
Categories: Accountability | Comments (0) | PermalinkRUT Weekly Calendar Trade #14 (Part 1)
Posted by Mark on July 30, 2015 at 07:12 | Last modified: August 6, 2015 10:17On July 14 with the market at 1269.25, I bought a 1270 calendar for $7.35. I got filled $0.10 off the mark.
Adjustment points were 1258 and 1283. While I felt it was not fun being back to narrower breakevens, last week’s trade with wider breakevens lost!
The market traded sideways for a few days but trading down to 1260 on July 20, I had to roll to 1255. I did not like only getting an additional five points but modeling the 1250 showed significant sag that would make the trade implausible. In retrospect, now with only a 15-point range, this trade itself may have been too narrow and implausible. A slight breeze is all it would have taken to force a second adjustment.
When I looked at the risk graph before market open on Tuesday (July 21), the expiration curve was much lower. That held after the open, too. I think this was more a subjective perception than anything else, though. I had a bad attitude about this trade from the very beginning because of the relatively narrow breakevens. TOS also makes it hard to determine exactly where the red [expiration] curve is at times on the risk graphs because they can vary from moment to moment. In retrospect, I noticed the 10:30 graph looked more pumped up than those earlier in the day. Unfortunately, I feel this negative attitude factored into my trade management.
I’ll conclude discussion of this trade in my next post.
Categories: Accountability | Comments (1) | PermalinkRUT Weekly Calendar Trade #13 (Part 1)
Posted by Mark on July 27, 2015 at 05:37 | Last modified: August 5, 2015 15:07This trade was placed on July 7 around 11:10 ET for $8.40 with the market around 1230. This is the most expensive calendar I had bought to date. That could be viewed as a sign to keep out of the trade in case elevated IV were to subsequently mean revert. A positive horizontal skew was poised to benefit this trade, though, as was seen with trade #12.
I found myself in a quandary on Friday with the market four points from the upside BE at 1254.
According to plan, on a continued move higher I should have adjusted to a double calendar. With real money on the line and facing the reality that a big upside move could land this trade down $250 or more at Monday’s open, I ended up closing half the trade.
This is why trading is difficult. Given the Greece referendum/vote on their financial crisis, I felt I had to act defensively. I figured if the market pulled back in such a way that I could have taken full profit but then couldn’t because I already closed half the trade at a big loss, I would be frustrated. It almost seemed irresponsible to leave on the entire risk or even to try centering the trade as a double calendar given a “market-related earnings announcement” being due over the weekend.
The market did indeed move higher on Monday and I closed the rest of the position at 9:45 with the market around 1261. This trade lost 16.2% in seven days.
Categories: Accountability | Comments (2) | PermalinkRUT Weekly Calendar Trade #12
Posted by Mark on July 24, 2015 at 07:26 | Last modified: August 5, 2015 14:33On June 30, 2015, I bought a 1250 calendar with the market right around that level. I placed the order $0.05 off the midprice and caved $0.10 over two minutes.
My contingent order to close triggered around 1 PM the very next day with the market at 1251.67. The trade made 10.2%.
This is the first time I have seen such a positive skew on the trade. Simply reverting to a normal horizontal skew would have probably hit the profit target; that may have been precisely what happened.
As testament to the horizontal skew, the breakevens were over 55 points apart at trade inception!
Categories: Accountability | Comments (2) | PermalinkRUT Weekly Calendar Trade #11
Posted by Mark on July 23, 2015 at 04:11 | Last modified: August 5, 2015 14:23On June 23, 2015, I bought a 1290 put calendar for 6.65 with the market at 1291.57.
My contingent order to close triggered at 3:11 ET on June 26 with the market at 1281.1. The market traded mostly sideways over the four days:
This trade made about 10% profit.
Categories: Accountability | Comments (0) | PermalinkWeekly Iron Condor Trade #5
Posted by Mark on July 21, 2015 at 06:10 | Last modified: July 16, 2015 12:17On July 1, 2015, I placed my fifth weekly iron condor trade. I placed this order $0.025 off the midprice (10:57) and caved a nickel two minutes later (filled $0.05 off the then mark).
Unlike the last JulWk2 trade, which should have been JulWk1, this position progressed without incident. The market drifted lower and volatility increased but this trade is negative delta at inception so that is okay.
This position made 5.4% in eight trading days.
Categories: Accountability | Comments (0) | Permalink