Truth in Backtesting (Part 8)
Posted by Mark on December 26, 2012 at 05:47 | Last modified: December 7, 2012 16:09In the last couple of posts, I have been taking a layperson’s approach to development of the CDC trading system with S&P 500 stocks. I started with initial backtests in http://www.optionfanatic.com/2012/12/21/truth-in-backtesting-part-6/ and have continued to explore one or two modifications at a time.
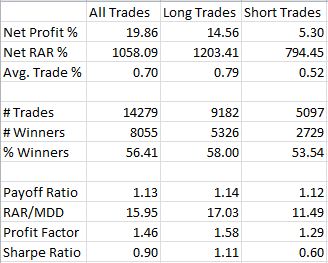
My next step is to exclude the 200-MA filter (or 50-MA filter, which was used in #21468) and see how the system performs with just the BB filter. This is backtest #21469 and should be contrasted to #21467 from http://www.optionfanatic.com/2012/12/24/truth-in-backtesting-part-7/ where just the 200-MA filter was active:
The results are very similar, which means adding either the BB filter or the 200-MA filter similarly improves the efficiency of the system.
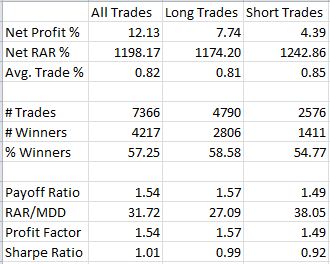
What if the BB filter is modified to make the overbought/oversold condition even stronger? I will now require a close outside the previous BB for the last two bars rather than one. This is backtest #21470:
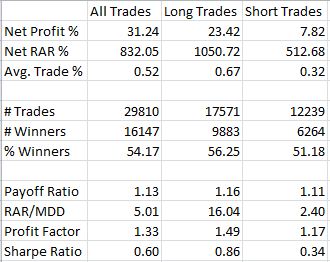
Compared to #21466 above, the short trades performed slightly better. The other numbers are roughly similar, though. The total number of trades is significantly reduced, which is to be expected, and the long trades still significantly outperform the short trades by a factor of almost three based on average trade %.
By this point I’m somewhat convinced that this system has promise. With tens of thousands of trades over nearly 33 years, this is not a surgical-strike system that trades infrequently and generates gobs of profit on average. This is a system that trades frequently and grinds out smaller profits with each swing.
The next step involves better understanding system exposure. I have been backtesting up to 500 open positions at once and an initial account equity of $50M. Neither of these is realistic because my account is smaller.
Categories: Backtesting | Comments (0) | PermalinkTruth in Backtesting (Part 7)
Posted by Mark on December 24, 2012 at 04:49 | Last modified: December 7, 2012 13:36In http://www.optionfanatic.com/2012/12/21/truth-in-backtesting-part-6/, I hypothetically wiped the slate clean of all accumulated book knowledge to illustrate some other misleading applications of the system development process. I am currently applying the CDC system to S&P 500 stocks the way an average Jane might approach system development with analytical software.
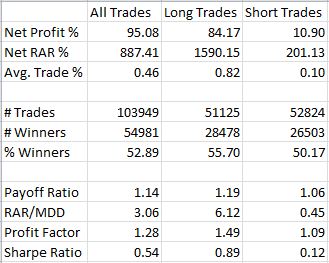
Backtest #21464 was an improvement over the one before it. The next step is to assess the impact of the Bollinger Band (BB) breakdown/breakout filter and 200-SMA filter by removing them. I also reset CDCs back to four. The following is backtest #21466 and should be compared to backtest #21463 (http://www.optionfanatic.com/2012/12/21/truth-in-backtesting-part-6/):
Net profit % and # trades are much larger, which suggests the filters had a dramatic effect. PF is down from 1.46 to 1.28 but for long trades, PF is 1.49 compared to 1.58 with the BB filter. That is not a big difference. In fact, everything about long trades here is much better than short trades: better RAR%, much better average trade %, much better subjective function, PF, and SR.
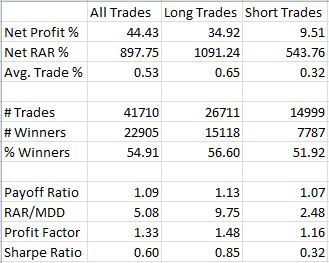
Since I made two changes to get these results, I will next reinstate the 200-MA filter. This is backtest #21467:
As with backtest #21466, long trades perform much better than short trades: average trade % is double, the subjective function is better than triple, PF and SR are all much improved.
What if the 200-MA filter is shortened such that long (short) trades are only taken when price closes above (below) the 50-MA instead? This is backtest #21468:
This decreased the number of trades and net profit % compared to #21467. That makes sense since the 50-MA will track closer to price than the 200-MA and therefore may be more restrictive. The efficiency of this system is comparable to the 200-MA system, however, based on net RAR%, the subjective function, PF, and SR.
I will continue this analysis with my next post.
Categories: Backtesting | Comments (0) | PermalinkTruth in Backtesting (Part 6)
Posted by Mark on December 21, 2012 at 02:47 | Last modified: December 7, 2012 13:24So far in this series (e.g. http://www.optionfanatic.com/2012/12/04/truth-in-backtesting-part-5/), I have discussed the misleading nature of EOD backtesting when trade delays are not used. Today I want to use the Consecutive Directional Close (CDC) system to start discussing another misleading aspect of backtesting: multiple positions.
Consider this the beginning of a new day. I wake up bright and early (well not so bright because I really do like to wake up extremely early), jump out of bed, and shake off all book knowledge pertaining to system development that I have accumulated over the past couple of years. My mind reverts to old patterns of knowledge. I just got AmiBroker and now I’m ready to play.
I start by coding the CDC system and setting the filter to S&P 500 stocks. I set initial equity to $50,000,000, maximum number of open positions to 500, number of CDCs to four, and length of trades to five. I set position size to $100,000 and I include a couple other filters in the buy and short conditions: Bollinger Band breakdown or breakout and price above or below the 200-SMA for long and short trades, respectively. I include a liquidity filter to make sure the position size divided by closing price is less than 1% of the average daily volume over the past 50 days. Backtesting dates are 1/1/1980 through 11/30/2012. Commissions are assessed at $8/trade. Buys and sells are executed at the next open.
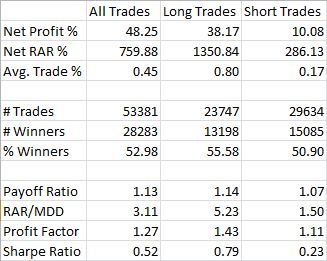
The results for backtest #21463 are as follows:
RAR = risk-adjusted return (i.e. performance if the system were in the market 100% of the time)
Payoff Ratio = average winning trade / average losing trade
RAR/MDD = the subjective function
I will use PF and SR as abbreviations for Profit Factor and Sharpe Ratio, respectively.
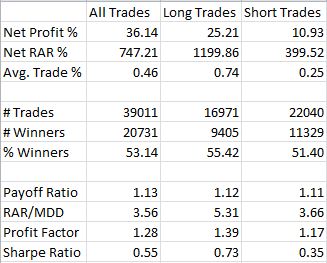
These results aren’t bad, but I want to see if I can make the system more efficient. I increase CDC to five. Here are the results of backtest #21464:
These results are better. While net profit is lower, the system has become more efficient (PF is higher along with payoff ratio, subjective function, and SR).
I will continue this analysis in my next post.
Categories: Backtesting, System Development | Comments (1) | PermalinkTrading System #3–Naked Puts (Part 1)
Posted by Mark on December 6, 2012 at 05:21 | Last modified: November 24, 2012 08:51The words “naked puts” are enough to turn most investors pale white only for the moment before they disappear in a puff of smoke for fear of losing everything. I feel comfortable with naked puts due to several years of live trading and backtesting experience. I would not recommend anybody trade naked puts until and unless they have accrued significant option trading experience along with years of backtesting to become intricately familiar with how they work. I may or may not spend more time writing some educational content later. For now, I want to stick with performance results of this trading system and to start analyzing some implications.
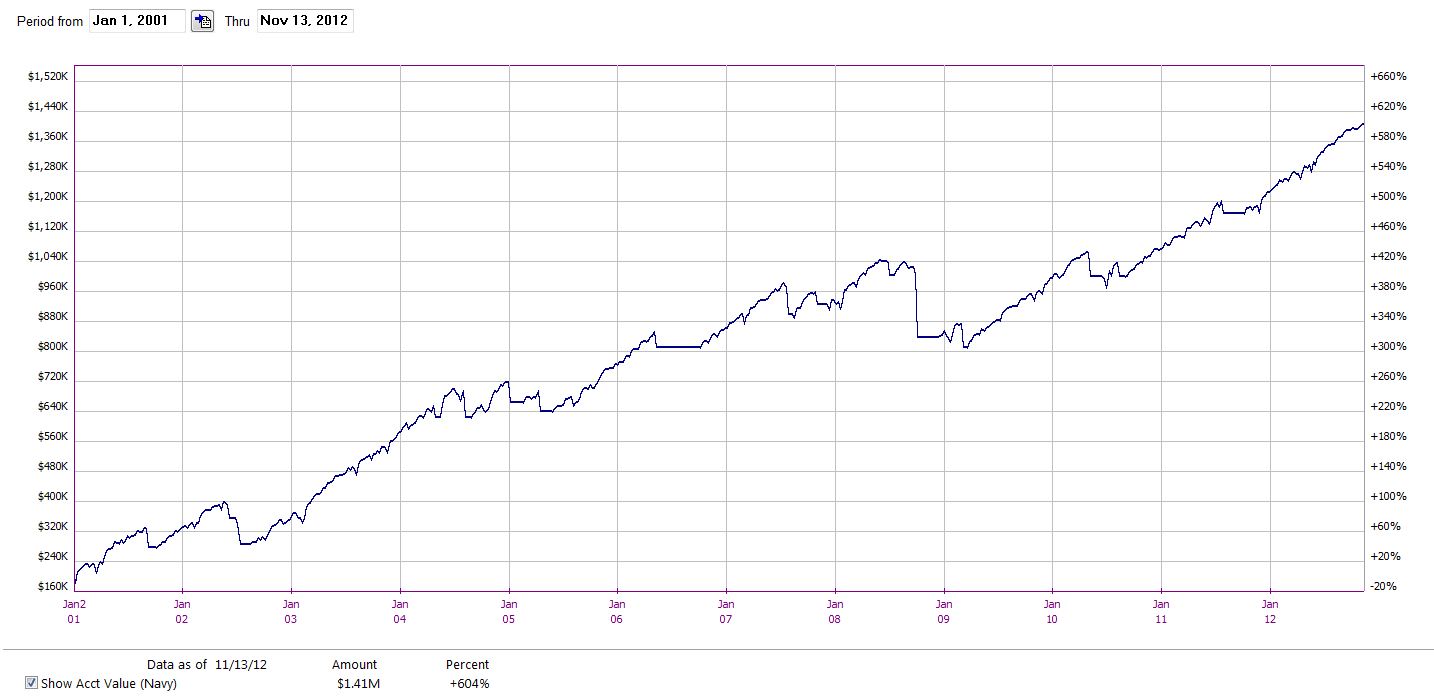
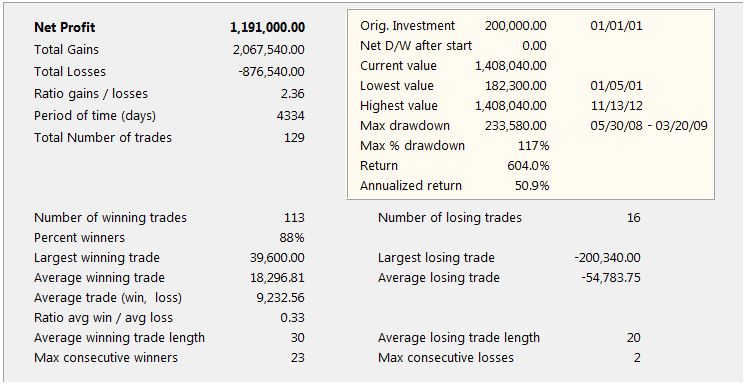
Here is an initial equity curve for the naked puts trading system:
Courtesy OptionVue 7, the initial performance analysis is as follows:
Take a couple minutes and study these numbers. I will begin to delve into the analysis with my next post.
Categories: Backtesting | Comments (2) | PermalinkTrading System #2–Consecutive Directional Close (Part 10)
Posted by Mark on November 27, 2012 at 07:27 | Last modified: November 23, 2012 05:34I am currently in the process of backtesting other broad-based indices with the CDC trading system. In http://www.optionfanatic.com/2012/11/23/trading-system-2-consecutive-directional-close-part-9, I backtested QQQ (Nasdaq 100). Today I will backtest IWM (Russell 2000 small caps).
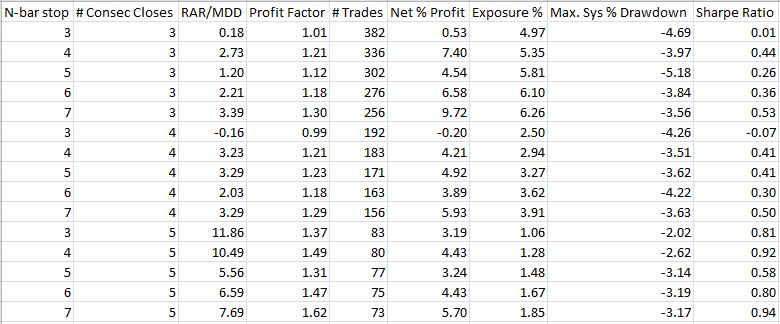
Once again I will backtest x = 3, 4, 5, 6, 7 and N = 3, 4, 5, 6, 7 with a minimum total trades number of 55 (see http://www.optionfanatic.com/2012/11/16/trading-system-2-consecutive-directional-close-part-5). I will include trade delays for buy and short trades with the understanding that any decent results I get may well be improved in live trading. Here are the results as sorted by subjective function (RAR/MDD):
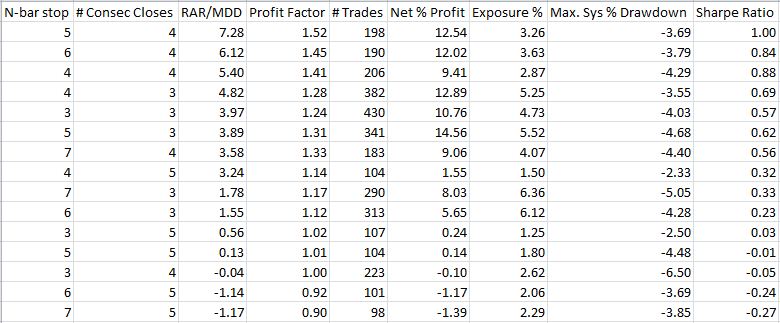
These numbers seem lackluster with a couple systems gaining nothing and most RAR/MDD < 5. As done with SPY and QQQ, I will next backtest long trades only:
Unlike SPY and QQQ, these numbers are actually worse.
When I see patterns in system development, I really want them to be robust. Why should long-only trades outperform for S&P 500 and Nasdaq stocks but not small caps? I’m sure imaginative types could come up with potential explanations but it makes me skeptical about the pattern since they’re all broad-based indices. If it’s not a real pattern then perhaps I should go back to studying long and short trades together. If the results are not satisfactory for both then perhaps I should waste no more time and move onto the next trading system concept.
This backtesting result has raised many conflicting points worthy of future discussion. I will sleep on it with hopes of a clearer head upon awakening!
Categories: Backtesting | Comments (0) | PermalinkTrading System #2–Consecutive Directional Close (Part 9)
Posted by Mark on November 23, 2012 at 03:18 | Last modified: November 23, 2012 05:03Back in http://www.optionfanatic.com/2012/11/16/trading-system-2-consecutive-directional-close-part-5, when facing an apparent sample size problem I suggested the inclusion of other broad based indices like QQQ and IWM for this trading strategy. It now appears that the problem may not only have been small sample size but also a difference between short and long trade performance. Today I will backtest QQQ.
I will start by backtesting x = 3, 4, 5, 6, 7 and N = 3, 4, 5, 6, 7 with a minimum total number of trades of 55 (see http://www.optionfanatic.com/2012/11/16/trading-system-2-consecutive-directional-close-part-5). In lieu of my last post, I did include trade delays here for buy and short trades. Here are the results as sorted by subjective function (RAR/MDD):
All systems with x = 6 or x = 7 were eliminated due to too few trades.
Compared to other backtesting done so far, these numbers are weak. First, not all systems backtested here are profitable. Second, all RAR/MDD numbers are in the single digits. Third, no PF exceeds 1.60.
Certainly the results would be better with no trade delays but that is not necessarily realistic.
In http://www.optionfanatic.com/2012/11/19/trading-system-2-consecutive-directional-close-part-6, I concluded by suggesting development of the CDC system to continue with long trades only. If I eliminate all short trades:
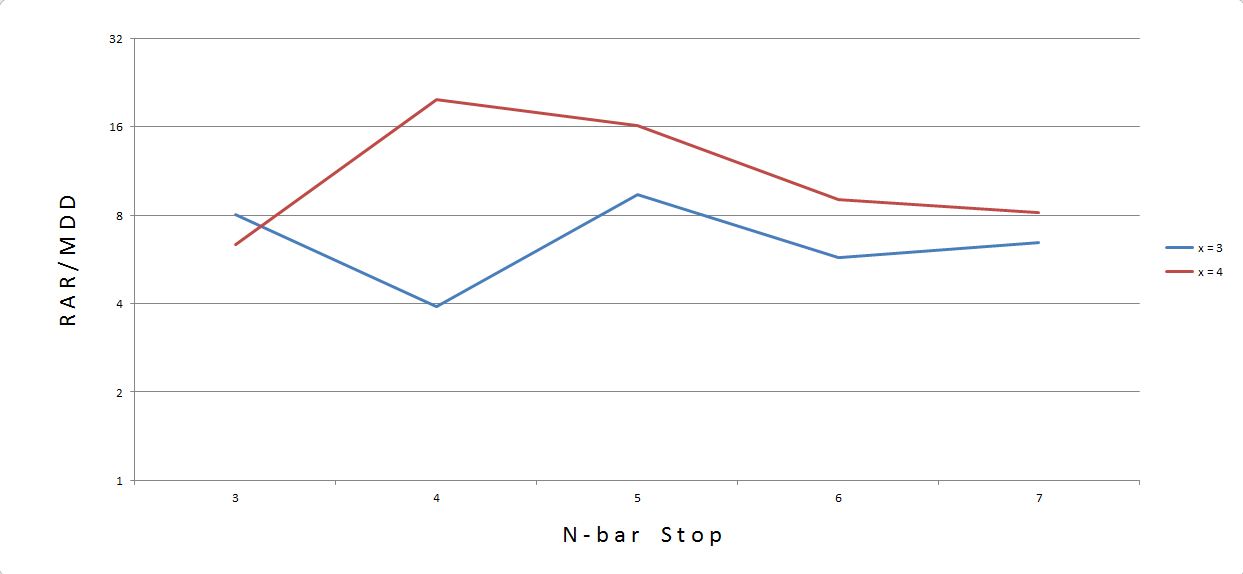
These numbers are an improvement. As a check for consistency/plateau region:
I would trade x = 4 since the red curve is above the blue curve for 80% of the data points (4 out of 5). Furthermore, with a 5-bar stop, I am in a somewhat stable area should performance be a bit better or worse than the backtested curve indicates.
In my next post, I’ll take a look at IWM.
Categories: Backtesting | Comments (1) | PermalinkTrading System #2–Consecutive Directional Close (Part 6)
Posted by Mark on November 19, 2012 at 03:32 | Last modified: October 31, 2012 13:17In http://www.optionfanatic.com/2012/11/16/trading-system-2-consecutive-directional-close-part-5, I settled on x = 4 and n = 5 as a potentially viable combination with which to trade the Consecutive Directional Close (CDC) system. The next step is to study long vs. short trade performance.
To do this, I used AmiBroker to conduct a series of backtests on the CDC system. I set x = 3, 4 and n = 3, 4, 5, 6, 7, which generated 10 sets of performance statistics:
Note the trends in the data. As the conditions get more extreme (higher values of x and n), total number of trades decreases and profitability generally decreases.
In order to directly compare the long trades vs. short trades, I ran a Student’s t test for independent samples. The results are as conclusive as the table appears:
These miniscule p-values suggest statistically significantly differences between the data.
I will continue future CDC system development with long trades only.
Categories: Backtesting | Comments (3) | Permalink
Trading System #2–Consecutive Directional Close (Part 4)
Posted by Mark on November 7, 2012 at 07:14 | Last modified: October 30, 2012 09:45In http://www.optionfanatic.com/2012/11/06/trading-system-2-consecutive-directional-close-part-3, I began to analyze what turned out to be some confusing data. Today I will try to better sort this out and see if the Consecutive Directional Close (CDC) trading system is one to salvage or discard.
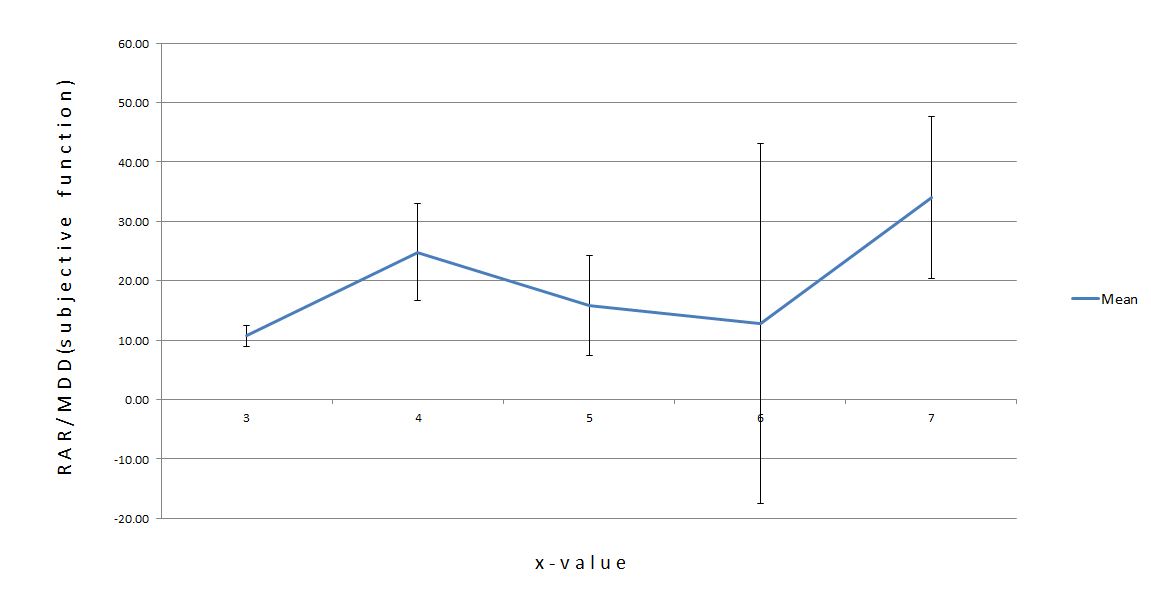
To refresh your memory, you may look back at Figure 1 and Table 2 from the last post. Here is a slightly different snapshot reflecting what I found:
This graph shows the mean RAR/MDD for x ranging from 3 to 7. To establish an x-value as “best,” one point must be separated above the others with no overlapping error bars. Because of the large error bars (especially on x = 6), no points show separation.
Are there any statisticians in the crowd? What is going on here?
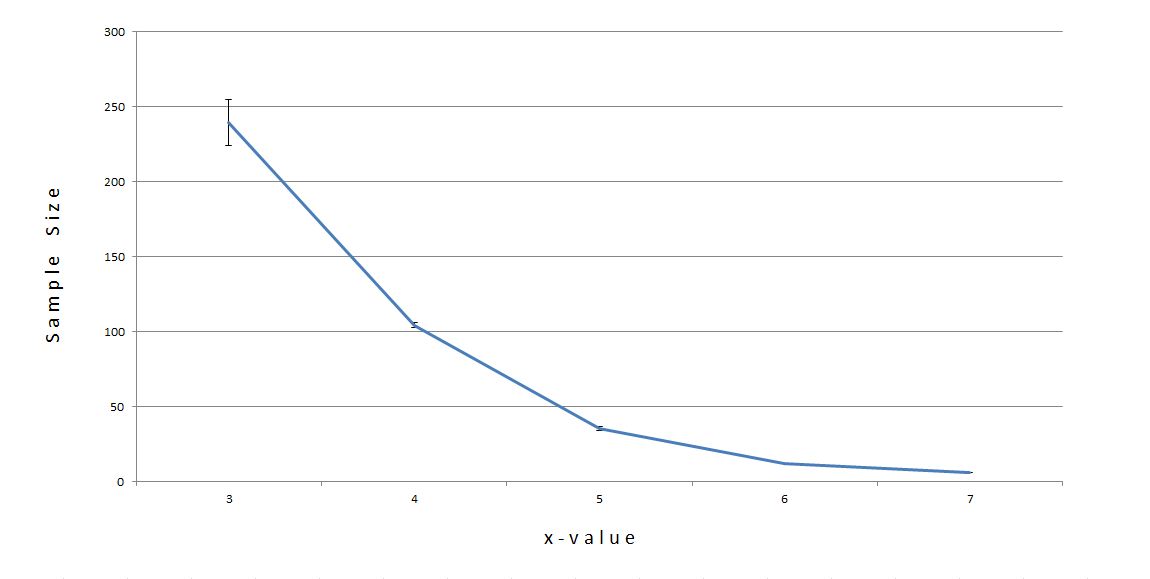
This is a problem with sample size:
The number of trades for x = 5, x = 6, and x = 7 were about 35, 12, and 6 respectively. Those numbers are too small for a valid sample size. I was not overjoyed with 57 trades in http://www.optionfanatic.com/2012/10/25/trading-system-1-spy-vix-part-9 but anything under 50 is totally unacceptable.
I must do something to increase the sample size from which to draw conclusions that may be predictive of future trading. To this end, I have two ideas. First, I can backtest other broad based indices and combine the results of all trades. Second, I can backtest the basket of 500 stocks that constitute the S&P 500 (SPY) separately. Although this may create more problems than it might solve, it can certainly be instructive for me to pursue.
I will continue with this analysis in my next post.
Categories: Backtesting | Comments (1) | PermalinkTrading System #2–Consecutive Directional Close (Part 3)
Posted by Mark on November 6, 2012 at 05:41 | Last modified: October 25, 2012 15:24In my last two posts, I talked about redundant trade signals. At this point I am going to ignore redundant signals to get a feel for how the Consecutive Directional Close (CDC) trading system performs all by itself.
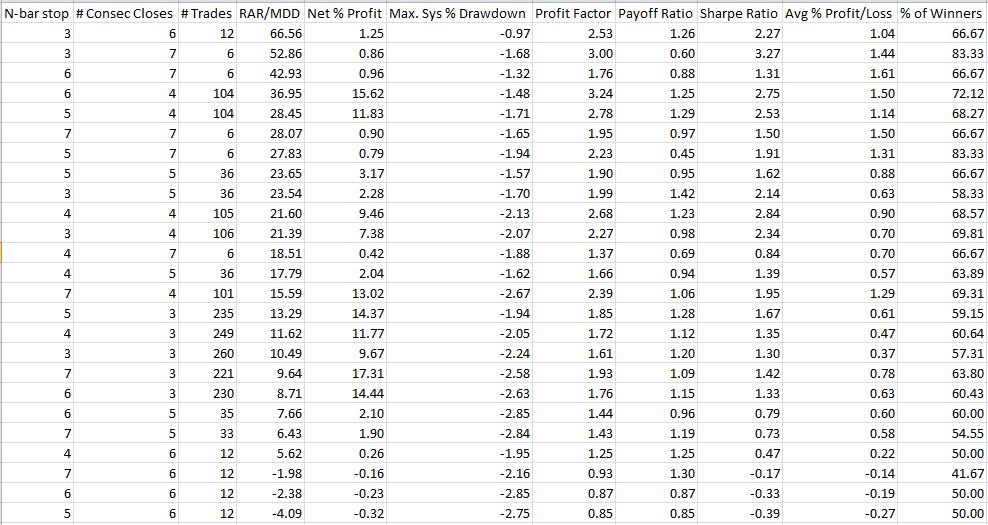
I began backtesting in http://www.optionfanatic.com/2012/11/01/trading-system-2-consecutive-directional-close-part-2 by studying x=3 and n=5. Now, I’m going to run an optimization to get a sense for backtesting results for x and n ranging between 3-7 (25 total systems). Just because I have another month of data, I’m going to extend the backtesting period to 9/30/2012:
Table 1
In contrast to http://www.optionfanatic.com/2012/10/02/trading-system-1-spy-vix-part-3-2, the first thing I notice here is that only 88% of these backtested systems were profitable. While 22 out of 25 is a high number, it falls short of the 100% I saw with the SPY VIX trading system.
The next thing I notice are some inconsistencies across x. This is a mean-reversion trading system and I would expect that more CDCs would result in larger returns. Indeed, the top three systems all had six or seven CDCs. However, the four worst-performing systems (including all three losers) also had six CDCs.
If I graph these numbers to check for plateau regions:
Figure 1
This is a much different graph than Figure 1 in http://www.optionfanatic.com/2012/10/11/the-subjective-function-part-5 where with a couple minor exceptions, the curve representing the most (least) extended trade condition was on top (bottom). Here, x = 6 starts out on top and dives into negative territory. x = 7 or x = 4 (can’t tell which) is below that followed by x = 5 and, as expected, x = 3 on the bottom (not really).
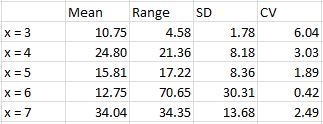
When I averaged across n-values, the statistics support the inconsistency:
Table 2
The huge range for x = 6 is seen here as it went from the best performing system to losing money. With higher CV (large mean and small SD) favorable, x = 3 looks impressive but its mean RAR/MDD is smallest and not very impressive.
I will continue this analysis with my next post.
Categories: Backtesting | Comments (2) | PermalinkTrading System #2–Consecutive Directional Close (Part 2)
Posted by Mark on November 1, 2012 at 07:12 | Last modified: February 4, 2015 10:11In http://www.optionfanatic.com/2012/10/31/consecutive-directional-close-part-1/, I introduced the Consecutive Directional Close trading system. Today I will begin the backtesting in order to see whether this might be worth trading live.
For starters, I will backtest SPY with x = 3 and n = 5. Recall that the two variables are number of consecutive closes (x) either up or down to trigger a short or long trade, respectively, and the number of days to hold the trade (n).
Other backtest settings include:
–Initial account value $1M
–Position size $100K
–$8 commission for each transaction
–Date range 1/29/1993 through 8/30/2012
–Subsequent buy/sell signals ignored once in a trade
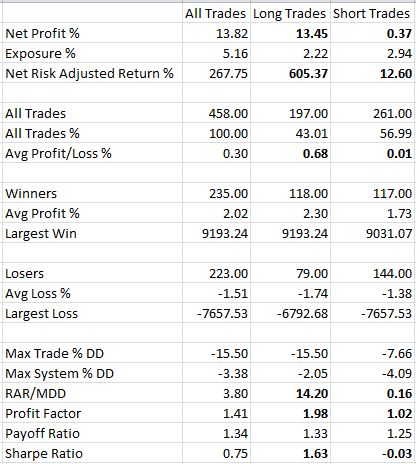
Here are the initial results:
With this variable combination, the system does look to be profitable but what really jumps out at me is a huge differential between long and short trades. Profit Factor for shorts is 1.02, which is barely profitable (probably not after slippage). Considering that 57% of all trades were short trades, I would strongly consider trading this long only, cutting exposure by 5.16% to 2.22%, and losing only a fraction of the net profit.
One thing I often wonder about is the final backtest setting to ignore subsequent signals once in a trade. Below are 10 consecutive trades beginning 6/12/2001 with this setting:
Contrast this with 10 consecutive trades beginning 6/12/2001 without this setting:
The yellow highlighting indicates subsequent trades that would not have been taken with the setting included. In the first case, an additional trade the following day compounded the initial loss. In the second case, additional trades taken on each of four successive days after the first resulted in a net profit rather than loss.
I will talk more about the implications of this in the next post.
Categories: Backtesting | Comments (3) | Permalink