Trading Epic Fury (Part 13)
Posted by Mark on April 21, 2026 at 06:45 | Last modified: May 7, 2026 14:36Now on the other side of Epic Fury recovery, I discuss the bullish case in Part 12 with regard to news and technical analysis. The latter is a potential trigger to get positive delta.
It’s hard to be sure, but over the last few years it feels like I have lost money with short calls. I often close a call and sell a put(s) to cover the cost. This masks the loss and unless I sell more puts and take on more downside exposure, my overall return will lag. The maneuver effectively extends time required to realize the initial profit thereby diluting annualized return.
The latter is juxtaposed with the benefit of otherwise wasting upside margin. Maintaining permanent downside exposure gives me the opportunity to take on some upside [exposure] with no additional [portfolio] margin requirement. Perhaps I might as well even if it’s limited [which unfortunately was not the case on too many candles beyond the Part 12 chart’s left arrow].
Whether or not I have actually lost money selling calls, looking at the bear markets and market corrections since 2008 makes it clear that recoveries have generally been quick (courtesy Google AI):
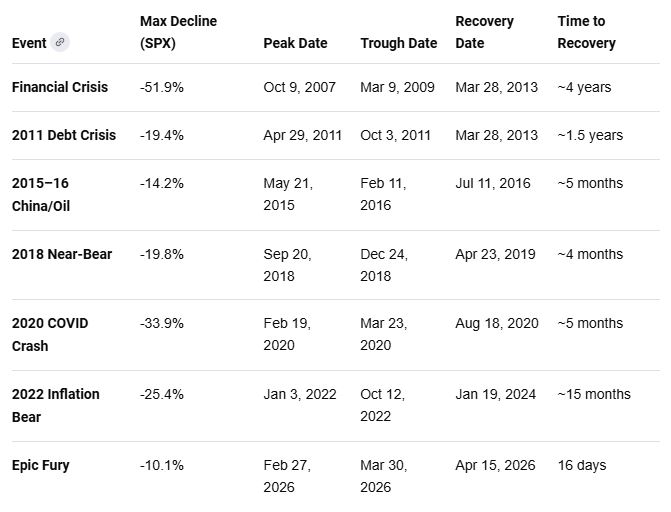
COVID is the fastest recovery from a 30%+ decline in history. Epic Fury is shallower and takes only a couple weeks to recover. Previous declines in 2018 and 2015-16 are also swift once the bottom is reached. Moral of the story: when the train leaves the station, I better be aboard.
What I am about to discuss would have worked for Epic Fury. Based on these quick recovery times, I suspect it would have also worked for other declines. It will be instructive to revisit these periods, though, to assess the worrisome whipsaw potential. I worry about removing upside exposure in favor of [more] downside only to immediately see the previous low taken out. That can devastate NLV and result in catastrophic loss.
Technicals can help determine when the train starts rolling. My gut feel (probably worth very little) tells me that while [price closes above the] 50- and 200-SMA are good recovery indicators, my trading may require a shorter period. This certainly applies to Epic Fury where I employed shorter and shorter-dated options including many at 0-1 DTE. The 20-SMA, reclaimed two candles before that [Part 12] left arrow, seems better suited and a significant event in and of itself being the first time since Epic Fury the market actually closes above [the 20-SMA or middle Bollinger Band].
I will continue next time.
Comments (1)
[…] Part 13, I explain where SPX crosses above the 20-SMA. Since I don’t actually know this until the […]