Trading Epic Fury (Part 9)
Posted by Mark on October 28, 2025 at 06:39 | Last modified: April 9, 2026 06:50The previous adjustments detailed at bottom of Part 7 proved unfortunate.
Trading on the final day of Q1 (one week ago) brings the following for SPX and VIX, respectively (circled candles):
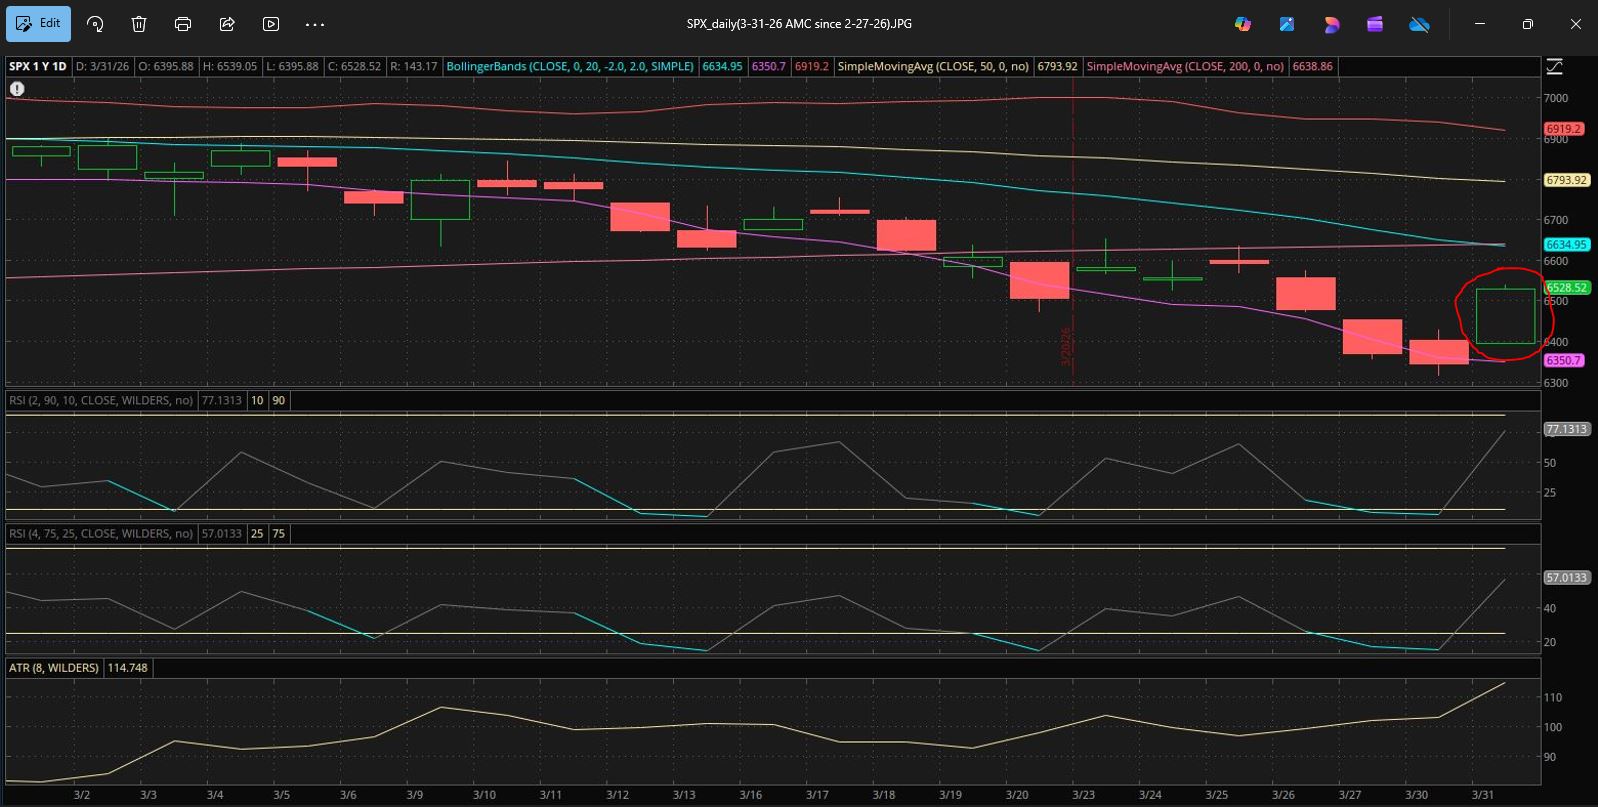
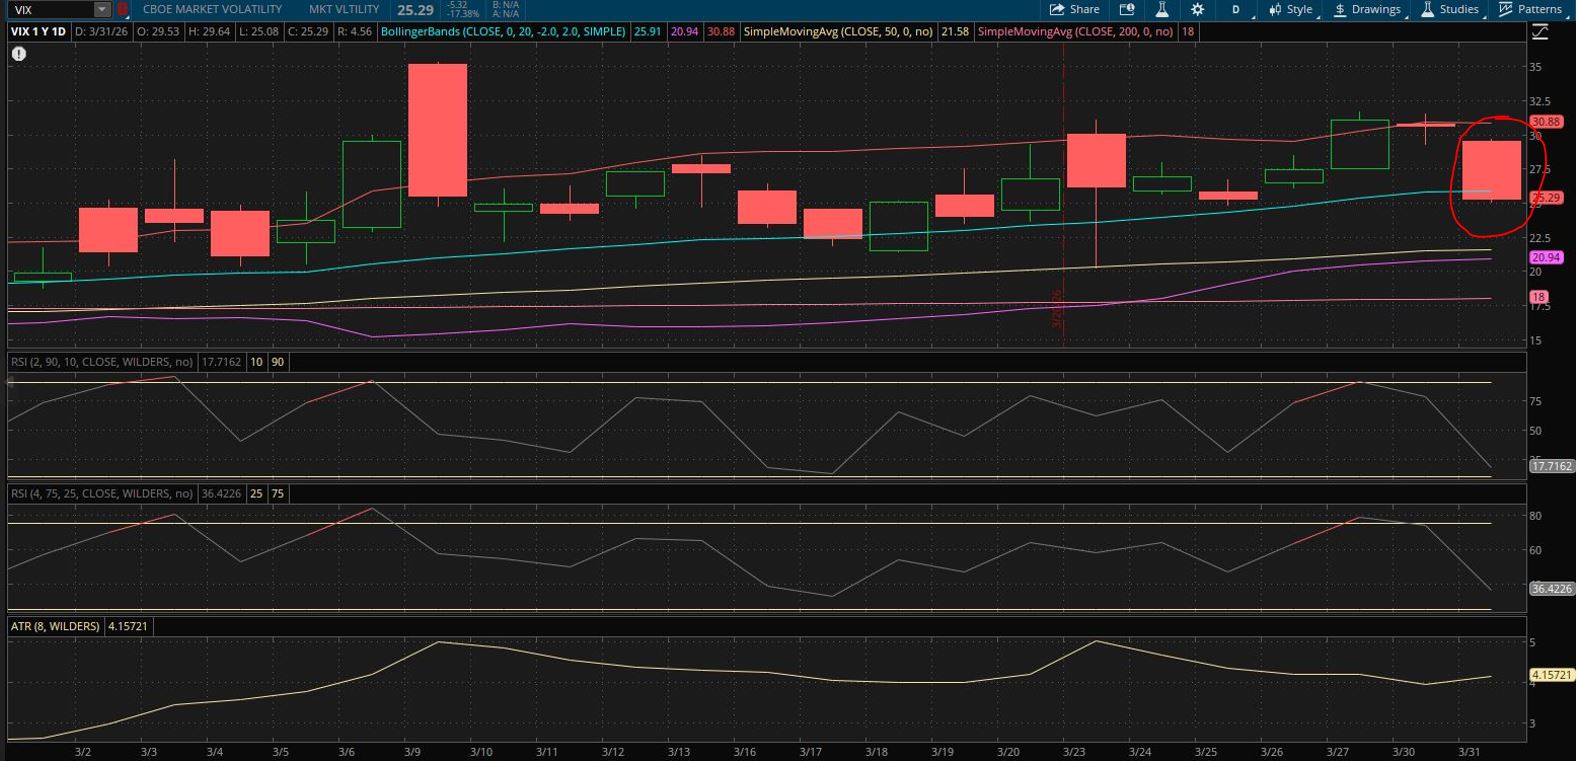
SPX rallies 2.9% and VIX falls 5.3 points (~17.5%). I lost 2.4% for a daily relative return of -5.3%. That hurts.
Going back to Part 7, (3) really did me in. Before checking the market on March 31 near EOD, I shuddered in thinking about -100 x number of short calls being my total potential upside delta exposure as described in paragraph 3 [albeit there talking about downside exposure]. The last thing I anticipated was a huge rally just then but “last-thing-I-expected” events happening on an all-too-frequent basis are one thing that make trading difficult.
With the dramatic increase in calls, my hope was for them to be gone within a couple trading days. Once again, I violated this final indicator. Hope is not a strategy. Once I begin hoping then I seriously open myself up to disaster.
It’s sometimes very difficult to walk away from big losses like the -3.1% discussed here. Failing to do so risks revenge trading. I will save that topic for another day, but this was a perfect illustration [and suggestive of another useful addition to the incident report checklist: “am I susceptible to revenge trading today?”].
I ignored a few different red flags in doubling short call exposure on March 30.
The first red flag was a doubling of gamma to levels previous unseen (in the brief month that I have so far been tracking daily greeks). This was necessary to cut position delta and restore TD to triple digits thereby leaving me able to sleep at night [selling more to get negative delta as suggested in Part 7 last paragraph then the day could have absolutely been a knockout blow]. It just doesn’t seem like a great solution especially in retrospect.
The second red flag was an oversold market. SPX RSI(2) < 10, RSI(4) < 10, and SPX price < lower BB for two consecutive days. Technical analysis is no guarantee [and recall the Keynes quote from Part 5 paragraph 3] but eventually one is really “tempting fate.” It’s known that some of the biggest up days in stock market history occur during sharp downturns or bear markets [but we’re not technically in a bear market so moving on]…
A third red flag was March 31. Final days of March are frequently bullish—per Google AI—and often driven by quarter-end portfolio rebalancing and window dressing. March is seasonally weak but final days can see a relief rally as funds adjust positions to reflect better performance for the end of the first quarter. “Window dressing” pertains to institutional portfolio managers buying (selling) top- (under-) performing stocks on the last day of the quarter to make holdings appear more robust in subsequent reports. Also with March weak, the 31st can see a surge due to short covering (investors covering bearish bets).
I will continue next time.
Categories: Accountability | Comments (4) | Permalink