UFPT Stock Study (3-6-26)
Posted by Mark on September 8, 2025 at 06:55 | Last modified: March 6, 2026 09:18I recently did a stock study on UFP Technologies Inc. (UFPT, $201.36).
M* writes:
> UFP Technologies Inc is a contract development and manufacturing
> organization that specializes in single-use and single-patient
> medical devices. The company manufactures its products by
> converting raw materials using laminating, molding, radio
> frequency, and impulse welding, and fabricating manufacturing
> techniques. It is an important link in the medical device supply
> chain and a valued outsource partner to many of the top medical
> device manufacturers in the world. The company’s single-use and
> single-patient devices and components are used in a wide range of
> medical devices, disposable wound care products, infection
> prevention, minimally invasive surgery, wearables, orthopedic
> soft goods, and orthopedic implant packaging.
Over the past decade, this small-size company grows sales and EPS at annualized rates of 17.7% and 26.7%, respectively. Lines are mostly up, straight, and parallel except for sales+EPS decline in ’20. Five- (10-) year EPS R^2 is 0.81 (0.89) and Value Line (VL) gives an Earnings Predictability score of 60. Shares outstanding increase 6.8% (0.7%/year).
Over the past decade, PTPM leads peer averages but trails the industry despite increasing from 8.4% to 13.7% (’25) with a last-5-year mean of 13.4%. ROE leads peer averages and is even with the industry while increasing from 7.1% to 16.7% (’25) with a last-5-year mean of 15.5%. Debt-to-Capital is less than peer and industry averages despite increasing from 0.8% to 26.7% (’25) with a last-5-year mean of 26.1%.
Quick Ratio is 1.4 and Interest Coverage 9.4 per M* who assigns “Narrow” [quantitative] Economic Moat and a B grade for Financial Health (BetterInvesting® website). VL rates the company B+ for Financial Strength.
With regard to sales growth:
- YF gives YOY ACE 6.0% and 5.7% for ’26 and ’27 (based on 4 analysts).
- Zacks gives YOY ACE 6.5% and 5.7% for ’26 and ’27, respectively (3 analysts).
- CFRA gives ACE 6.2% YOY and 5.9% per year for ’26 and ’25-’27, respectively (4).
I am forecasting below the range at 4.0% per year.
With regard to EPS growth:
- MarketWatch projects 10.5% YOY and 11.4% per year for ’26 and ’25-’27, respectively (based on 4 analysts).
- Nasdaq.com gives ACE 11.6% YOY for ’27 (3 analysts).
- YF gives YOY ACE 4.9% and 11.8% for ’26 and ’27, respectively (4).
- Zacks gives YOY ACE 4.5% and 11.6% for ’26 and ’27, respectively (3).
- VL gives ACE 14.3% annualized from 2024 to 2026 / 2027 (3).
- CFRA gives ACE 17.0% YOY and 14.4% per year for ’26 and ’25-’27, respectively (4).
Analyst estimates are scant with VL providing the longest-term estimate at only 2.5 years out. My 7.0% forecast is near bottom of the short- and longer-term range. Initial value is ’25 EPS of $8.75/share.
My Forecast High P/E is 26.0. Over the past 10 years, high P/E increases from 25.0 to 33.1 (’25) with a last-5-year mean of 35.2 and last-5-year-mean average P/E of 26.6. I am below the range.
My Forecast Low P/E is 13.0. Over the past 10 years, low P/E ranges from 10.3 in ’22 to 21.1 in ’21 with a last-5-year mean of 17.9. I am forecasting near bottom of the range [only ’22 and ’19 (10.6) are less].
My Low Stock Price Forecast (LSPF) is $140.00. Default ($114.10) given initial value from above seems unreasonably low at 43.3% less than previous close and 36.0% less than 52-week low. My [arbitrary] selection is 30.5% and 21.5% less, respectively (and results in an effective Forecast Low P/E of 16.0).
These inputs land UFPT in the HOLD zone with a U/D ratio of 1.9. Total Annualized Return (TAR) is 9.6%.
PAR (using Forecast Average—not High—P/E) of 3.5% is less than I seek for a small-size company. If a healthy margin of safety (MOS) anchors this study, then I can proceed based on TAR instead.
To assess MOS, I compare my inputs with Member Sentiment (MS). Based on 70 studies done in the past 90 days (my study and 38 other outliers excluded), averages (lower of mean/median) for projected sales growth, projected EPS growth, Forecast High P/E, and Forecast Low P/E are 13.2%, 12.8%, 30.0, and 17.3 respectively. I am lower across the board.
MS high / low EPS are $15.68 / $8.63 vs. $12.27 / $8.75 (per share). My high EPS is less due mainly to a lower growth rate.
MS LSPF of $155.30 implies a Forecast Low P/E of 18.0: greater than the above-stated 17.3. MS LSPF is 4.0% greater than the default $8.63/share * 17.3 = $149.30 that results in more aggressive zoning. MS LSPF is also 10.9% greater than mine.
MOS is robust in the study because my inputs are [near or] less than [bottom of] historical/analyst/MS averages/ranges. Also backing this assessment is MS TAR exceeding mine by 5.9% per year and my lower LSPF.
Regarding valuation, PEG is 3.1 per my projected P/E: overvalued. Relative Value [(current P/E) / 5-year-mean average P/E] is slightly low at 0.86. M* says stock trades at a 9% discount.
Per U/D, UFPT is a BUY under ~$185/share. BetterInvesting® TAR criterion would be met [319.1 / ((14.87 / 100 ) +1 ) ^ 5] ~ $160 given a forecast high price ~$319 (no dividend).
A 90-day free trial to BetterInvesting® may be secured here (also see link under “Pages” section at top right of this page).
Categories: BetterInvesting® | Comments (0) | PermalinkBRO Stock Study (3-3-26)
Posted by Mark on August 28, 2025 at 07:09 | Last modified: March 4, 2026 08:10I recently did a stock study on Brown & Brown, Inc. (BRO, $72.36).
M* writes:
> Brown & Brown Inc is a diversified insurance agency, wholesale
> brokerage, insurance programs, and service. The company’s business
> is divided into two reportable segments: (i) the Retail segment,
> and (ii) the Specialty Distribution segment. The Retail segment
> provides a broad range of insurance products and services to
> commercial, public and quasi-public entities, and to professional
> and individual customers, as well as non-insurance warranty
> services and products through automobile and recreational vehicle
> dealer services businesses. The Specialty Distribution segment
> consists of wholesale brokerage and specialty businesses.
> Its geographic area is U.S, U.K and Others.
Over the past decade, this medium-size company grows sales and EPS at annualized rates of 14.4% and 15.6%, respectively. Lines are mostly up, straight, and parallel except for EPS dips in ’18 and ’25. Five-year EPS R^2 is 0.81 and Value Line (VL) gives an Earnings Predictability score of 95. Shares outstanding increase 13.6% (1.4%/year).
Over the past decade, PTPM leads peer and industry averages while ranging from 22.1% (’19) to 27.7% (’24) with a last-5-year mean of 25.7%. ROE trails peer and industry averages while falling from 11.0% to 8.6% (’25) with a last-5-year mean of 14.1%. Debt-to-Capital is less than peer and industry averages despite increasing from 31.3% to 38.7% (’25) with a last-5-year mean of 40.4%.
Quick Ratio is 0.56 and Interest Coverage 5.5 per M* who assigns “Narrow” Economic Moat but a C grade for Financial Health (BetterInvesting® website). VL rates the company A for Financial Strength (Interest Coverage 7.8).
With regard to sales growth:
- YF gives YOY ACE 21.9% and 6.9% for ’26 and ’27 (based on 11 analysts).
- Zacks gives YOY ACE 23.5% and 5.9% for ’26 and ’27, respectively (6 analysts).
- VL projects 12.2% annualized from ’24-’29.
- CFRA projects 15.0% YOY and 13.5% per year for ’26 and ’25-’27, respectively.
- M* offers a 2-year ACE of 15.4%.
I am forecasting below the range at 6.0% per year.
With regard to EPS growth:
- MarketWatch projects 8.7% and 8.2% per year for ’25-’27 and ’25-’28, respectively (based on 20 analysts).
- Nasdaq.com gives ACE 9.9% YOY and 8.4%/year for ’27 and ’26-’28 [9 / 8 / 1 analyst(s) for ’26 / ’27 / ’28].
- Seeking Alpha projects 4-year annualized growth of 7.3%.
- Argus projects 5-year annualized growth of 10.0%.
- Finviz gives ACE 5-year annualized growth of 8.1% (6).
- LSEG estimates LTG at 7.4%.
- YF gives YOY ACE 6.1% and 10.2% for ’26 and ’27, respectively (16).
- Zacks gives YOY ACE 7.0% and 9.7% for ’26 and ’27 (7) along with 5-year annualized growth of 7.3%.
- VL projects 9.7% annualized from ’24-’29.
- CFRA projects 5.6% YOY and 7.8% per year for ’26 and ’25-’27 along with 3-year CAGR of 11.0%.
My 7.0% forecast is below the long-term-estimate range (mean of six: 8.3%). Initial value is ’25 EPS of $3.16/share.
My Forecast High P/E is 25.0. Over the past 10 years, high P/E ranges from 18.7 in ’17 to 39.8 in ’25 with a last-5-year mean of 32.6 and last-5-year-mean average P/E of 26.8. I am near bottom of the range (only ’17 is less).
My Forecast Low P/E is 15.0. Over the past 10 years, low P/E ranges from 14.6 in ’17 to 24.1 in ’25 with a last-5-year mean of 20.9. I am forecasting near bottom of the range (only ’17 is less).
My Low Stock Price Forecast (LSPF) of $48.00 is default based on initial value from above. This is 33.7% less than previous close and 26.9% less than the 52-week low.
Over the last 10 years, Payout Ratio (PR) falls from 27.6% in ’16 to 19.5% in ’25 with a last-5-year mean of 17.4%. I am forecasting below the range at 15.0%.
These inputs land BRO in the HOLD zone with a U/D ratio of 1.6. Total Annualized Return (TAR) is 9.5%.
PAR (using Forecast Average—not High—P/E) of 4.9% is less than I seek for a medium-size company. If a healthy margin of safety (MOS) anchors this study, then I can proceed based on TAR instead.
To assess MOS, I compare my inputs with those of Member Sentiment (MS). Based on 77 studies done in the past 90 days (my study and 37 other outliers excluded), averages (lower of mean/median) for projected sales growth, projected EPS growth, Forecast High P/E, Forecast Low P/E, and PR are 11.7%, 11.3%, 29.2, 19.7, and 17.6% respectively. I am lower across the board. VL projects a future average annual P/E of 22.5 that is less than MS (24.5) and greater than mine (20.0).
MS high / low EPS are $5.57 / $3.20 versus my $4.43 / $3.16 (per share). My high EPS is less due to a lower growth rate. VL high EPS of $5.50 is in the middle.
MS LSPF of $61.00 implies a Forecast Low P/E of 19.1: less than the above-stated 19.7. MS LSPF is 3.2% less than the default $3.20/share * 19.7 = $63.04 that results in more conservative zoning. MS LSPF is 27.1% greater than mine, however.
MOS is robust in the study because my inputs are [near or] less than [bottom of] historical/analyst/MS averages/ranges. Also backing this assessment are MS TAR exceeding mine by 8.6% per year [arguably too high] and the much greater LSPF.
Regarding valuation, PEG is 2.2 and 3.0 per Zacks and my projected P/E: slightly overvalued (1.7 per M*). Relative Value [(current P/E) / 5-year-mean average P/E] is somewhat low at 0.84. “Quick and Dirty DCF” calculates stock undervalued by 29% (M* currently says 25% discount).
I wish I hadn’t seen two things about this stock. First, the Financial Health grade of C (M*) is diametrically-opposed to the VL A-rating (Financial Strength). Also questionable is a “smart score” of 1 (“likely underperform”) by CNN Business. I don’t know how reliable the metric, but I can never recall seeing a 1 before.†
On the other hand, Cy Lynch does present the company as his Manifest Investing Round Table selection for Feb 2026.
Per U/D, BRO is a BUY under ~$63.50/share. BetterInvesting® TAR criterion would be met [110.8 / ((14.07 / 100 ) +1 ) ^ 5] ~ $57 given a forecast high price ~$111.
A 90-day free trial to BetterInvesting® may be secured here (also see link under “Pages” section at top right of this page).
†—“Smart score” pertains only to the next 12 months rather than long-term.
NOW Stock Study (2-21-26)
Posted by Mark on August 8, 2025 at 09:05 | Last modified: February 21, 2026 11:17I recently did a stock study on ServiceNow, Inc. (NOW, $104.27).
M* writes:
> ServiceNow Inc provides software solutions to structure and automate
> various business processes via a SaaS delivery model. The company
> primarily focuses on the IT function for enterprise customers.
> ServiceNow began with IT service management, expanded within the
> IT function, and more recently directed its workflow automation
> logic to functional areas beyond IT, notably customer service,
> HR service delivery, and security operations. ServiceNow also
> offers an application development platform as a service.
Since 2019, this large-size company grows sales and EPS at annualized rates of 24.9% and 41.9%, respectively (’16-’18 excluded due negative earnings in two of three years). Lines are mostly up, straight, and narrowing except for EPS declines in ’20 and ’24. Seven- (Five-) year EPS R^2 is 0.51 (0.78). Value Line (VL) gives an Earnings Predictability score of 30. Shares outstanding increase 6.1% (1.0%/year).
Since 2019, PTPM trails peer and industry averages despite increasing from 1.9% to 17.0% (’25) with a last-5-year mean of 10.7%. ROE is about even with peer and industry averages despite falling from 42.2% to 15.5% (’25) with a last-5-year mean of 13.7%. Debt-to-Capital is less than peer and industry averages while falling from 34.7% to 15.6% (’25) with a last-5-year mean of 25.2%.
Quick Ratio is 0.85 and Interest Coverage 99.3 per M* who assigns “Wide” Economic Moat, gives “Exemplary” rating for Capital Allocation, but a B grade for Financial Health (BetterInvesting® website). VL rates the company A for Financial Strength.
With regard to sales growth:
- YF gives YOY ACE 20.1% and 18.5% for ’26 and ’27 (based on 41 analysts).
- Zacks gives YOY ACE 20.3% and 18.0% for ’26 and ’27, respectively (13 analysts).
- VL projects 13.8% annualized from ’24-’29.
- CFRA projects 20.8% YOY and 19.2% per year for ’26 and ’25-’27, respectively.
- M* offers a 2-year ACE of 19.1% and projects 17.0% per year x5 years (analyst report).
I am forecasting below the range at 13.0% per year.
With regard to EPS growth:
- MarketWatch projects 20.3% and 21.2% per year for ’25-’27 and ’25-’28, respectively (based on 47 analysts).
- Nasdaq.com gives ACE 25.4% YOY and 27.5%/year for ’27 and ’26-’28 (17 / 13 / 2 analysts for ’26 / ’27 / ’28).
- Seeking Alpha projects 4-year annualized growth of 23.6%.
- Argus projects 5-year annualized growth of 21.0%.
- Finviz gives ACE 5-year annualized growth of 20.6% (9).
- LSEG estimates LTG at 20.2%.
- YF gives YOY ACE 18.6% and 20.4% for ’26 and ’27, respectively (41).
- Zacks gives YOY ACE 17.7% and 19.6% for ’26 and ’27 (14) along with 5-year annualized growth of 23.9%.
- VL projects 26.3% annualized from ’24-’29.
- CFRA projects 19.4% YOY and 18.8% per year for ’26 and ’25-’27 along with 3-year CAGR of 17.0%.
- M* gives long-term ACE of 27.2% and projects 24.8% from ’25-’29 in Equity Report.
My 19.0% forecast is below the long-term-estimate range (mean of eight: 23.5%). Initial value is ’25 EPS of $1.67/share.
My Forecast High P/E is 53.0. Since 2019, three of seven are over 400 (highest 960). Excluding those as extreme, high P/E ranges from 85.6 in ’23 to 169 in ’24 with a last-5-year mean of 133 and last-5-year-mean average P/E of 103 (corresponding years excluded from low P/E calculation). I am below the range (and current P/E of 62.5).
My Forecast Low P/E is 35.0. Since 2019, three of seven are over 200 (highest 405). Excluding those as extreme, low P/E ranges from 42.0 in ’23 to 93.3 in ’24 with a last-5-year mean of 72.2. I am forecasting below the range.
My Low Stock Price Forecast (LSPF) is $70.00. Default ($58.40) based on initial value from above seems unreasonably low at 44.0% less than the previous close and 40.4% less than the 52-week low. My [arbitrary] selection is 32.9% and 28.6% less, respectively. My Forecast Low P/E is effectively $70.00 / $1.67 = 41.9.
These inputs land NOW in the BUY zone with a U/D ratio of 3.2. Total Annualized Return (TAR) is 15.6%.
PAR (using Forecast Average—not High—P/E) of 11.2% is decent for a large-size company. If a healthy margin of safety (MOS) anchors this study, then I can proceed based on TAR instead.
To assess MOS, I compare my inputs with those of Member Sentiment (MS). Based on 70 studies done in the past 90 days (my study and 18 outliers excluded), averages (lower of mean/median) for projected sales growth, projected EPS growth, Forecast High P/E, and Forecast Low P/E are 17.1%, 20.1%, 76.0, and 50.0 respectively. I am lower across the board. VL [M*] projects a future average annual P/E of 50.0 [15.4—unreasonably low and I suspect they use current rather than future stock price] that is less than MS (63.0) and greater than mine (effectively 47.5).
MS high / low EPS are $4.16 / $1.67 versus my $3.99 / $1.67 (per share). My high EPS is less due to a lower growth rate. VL [M*] high EPS of $4.40 [$4.05] is higher than both [in the middle].
MS LSPF of $83.80 implies a Forecast Low P/E of 50.2, which is almost equal to the above-stated 50.0. MS LSPF is 19.7% greater than mine, however: much more aggressive.
MOS is robust in the study because my inputs are near or below historical/analyst/MS averages/ranges. Also backing this assessment are MS TAR exceeding mine by 5.1% per year and the greater LSPF.
Regarding valuation, PEG is 1.1 and 2.8 per Zacks and my projected P/E—slightly overvalued, perhaps (M* is undervalued at 0.89). Relative Value [(current P/E) / 5-year-mean average P/E] is quite low at 0.61. “Quick and Dirty DCF” calculates stock overvalued by ~23% (high projected CapEx).
Per U/D, NOW is a BUY under ~$106/share. BetterInvesting® TAR criterion would be met [215.5 / ((14.87 / 100 ) +1 ) ^ 5]
~ $108 given a forecast high price ~$216 (no dividend).
A 90-day free trial to BetterInvesting® may be secured here (also see link under “Pages” section at top right of this page).
Categories: BetterInvesting® | Comments (0) | PermalinkVRT Stock Study (2-19-26)
Posted by Mark on August 5, 2025 at 07:01 | Last modified: February 19, 2026 11:07I recently did a stock study on Vertiv Holdings Co. (VRT, $243.21).
M* writes:
> Vertiv has roots tracing back to 1946 when its founder, Ralph Liebert,
> developed an air-cooling system for mainframe data rooms. As computers
> started making their way into commercial applications in 1965, Liebert
> developed one of the first computer room air conditioning, or CRAC,
> units, enabling the precise control of temperature and humidity. The
> firm has slowly expanded its data center portfolio through internal
> product development and the acquisition of thermal and power
> management products like condensers, busways, and switches. Vertiv
> has global operations today; its products can be found in data
> centers in most regions throughout the world.
Since 2018, this large-size company is all over the place [M* states it went public in 2020 despite price bars showing on the BetterInvesting® website for the two years prior]. Sales are positive since first recording any in 2020. EPS crosses zero four times, however. To sufficiently clean up the chart, I have to exclude 2017-2022 leaving a brief 3-year data history. Over that time, sales and EPS grow at annualized rates of 22.1% and 69.3%, respectively, with lines up, mostly straight, and parallel. Value Line (VL) gives Earnings Predictability score of 30 and Stock Price Stability score of only 10.
VRT is #6 on the “Top 40 Stocks Purchased by Investment Clubs” [in the past month] stock screen as of 2/10/26 (nod to the BetterInvesting® Weekly Update email). Personally, I do not think the stock passes visual inspection and would move on. M* writes, “spending on data centers has become more volatile and less predictable. Estimating Vertiv’s growth is therefore a highly erroneous exercise.” It also writes, “Vertiv’s financial history is somewhat limited given that it has changed ownership a number of times between public and private entities.” In case so many clubs are onto something here, I will proceed with the study. To be safe, perhaps give only speculative consideration for this stock with non-core position sizing.
Since 2023, PTPM leads industry averages while increasing from 7.8% to 17.0% (’25). ROE increases from 26.5% to 37.2% (’25). Debt-to-Capital decreases from 60.8% to 45.0% (’25). Three years seems very brief and too short for meaningful peers/industry comparison.
Quick Ratio is 1.12 and Interest Coverage is 21.2 per M* who assigns “Narrow” Economic Moat and gives a B grade for Financial Health (per BetterInvesting® website). VL rates the company B++ for Financial Strength.
With regard to sales growth:
- YF gives YOY ACE 46.1% and 28.9% [both percentages equal to below] for ’26 and ’27 (based on 22 analysts).
- Zacks gives YOY ACE 34.0% and 24.0% for ’26 and ’27, respectively (8 analysts).
- VL projects 11.8% annualized growth from ’24-’29.
- CFRA projects 32.8% YOY and 28.3% per year for ’26 and ’25-’27, respectively.
- M* offers a 2-year ACE of 25.9% and projects 16.6% per year from ’25-’30 (Equity Report).
I am forecasting below the range at 11.0% per year.
With regard to EPS growth:
- MarketWatch projects 39.3% and 34.2% per year for ’25-’27 and ’25-’28, respectively (based on 27 analysts).
- Nasdaq.com gives ACE 23.3% and 24.1%/year for ’26-’28 and ’26-’29 [7 / 8 / 1 analyst(s) for ’26 / ’28 / ’29].
- Seeking Alpha projects 4-year annualized growth of 32.2%.
- Finviz gives ACE 5-year annualized growth of 33.4% (9).
- LSEG estimates LTG at 31.4%.
- YF gives YOY ACE 46.1% and 28.9% for ’26 and ’27, respectively (22) [something seems amiss as both equal to above].
- Zacks gives YOY ACE 46.9% and 30.2% for ’26 and ’27 (7) along with 5-year annualized growth of 31.0%.
- VL projects 40.5% annualized from ’24-’29 (most recent report is Dec ’25, however, and 2025 full-year earnings have since been announced. I will use VL’s $4.10 estimate for 2025 to get 14.3% instead).
- CFRA projects 43.8% YOY and 39.3% per year for ’26 and ’25-’27 along with 3-year CAGR of 28.0%.
- M* gives long-term ACE of 26.1% and projects 16.2% from ’25-’30 in Equity Report (using ’29 would give 29.4% but I am using the lesser).
My 14.0% forecast is below the long-term-estimate range (mean of seven: 26.4%). Initial value is ’25 EPS of $3.41/share.
My Forecast High P/E is 40.0. Over past three years, high P/E is 42.2, 114, and 59.4. The last-3-year mean average P/E is 46.0. I am just below the range.
My Forecast Low P/E is 15.0. Over past three years, low P/E is 10.0, 34.6, and 15.7. I am forecasting just below the median.
My Low Stock Price Forecast (LSPF) is $60.00. Default ($51.20) based on initial value from above seems unreasonably low at 78.9% less than the previous close but only 4.5% less than the 52-week low. My [arbitrary] selection is 75.3% less than the previous close and 11.9% greater than the 52-week low. My effective Forecast Low P/E is therefore $60.0 / $3.41 = 17.6.
Over the past three years, Payout Ratio (PR) is 2.1%, 8.8%, and 5.1%. I am forecasting below the range at 2.0%.
These inputs land VRT in the SELL zone with a U/D ratio of 0.1. Total Annualized Return (TAR) is 1.6%.
PAR (using Forecast Average—not High—P/E) of -5.7% is unthinkable as an investment candidate. If a healthy margin of safety (MOS) anchors this study, then I can proceed based on TAR but even that is far below the risk-free rate (T-bills).
To assess MOS, I compare my inputs with those of Member Sentiment (MS). Based on 114 studies done in the past 90 days (65 outliers including mine excluded), averages (lower of mean/median) for projected sales growth, projected EPS growth, Forecast High P/E, Forecast Low P/E, and PR are 17.8%, 25.0%, 59.9, 31.1, and 4.7% respectively. I am lower across the board. VL [M*] projects a future average annual P/E of 32.0 [20.7 and 27.4 in ’29 and ’30, respectively] that is less than MS (40.5) and greater than mine (effectively 28.8).
MS high / low EPS are $7.13 / $2.65 versus my $6.57 / $3.41 (per share). My high EPS is less due to a lower growth rate. VL [M*] high EPS of $7.00 [$8.88 for ’30] is in the middle [soars above both].
MS LSPF of $87.30 implies a Forecast Low P/E of 32.9 versus the above-stated 31.1. MS LSPF is 5.9% greater than the default $2.65/share * 31.1 = $82.42 that results in more aggressive zoning. MS LSPF is a whopping 45.5% greater than mine.
MOS is robust in the study because my inputs are near or below historical/analyst/MS averages/ranges. Also backing this assessment are MS TAR exceeding mine by a gaudy 17.4% per year and a much greater LSPF.
With regard to valuation, PEG is 1.3 and 4.5 per Zacks and my projected P/E: diametrically opposed. I find it interesting that both Zacks and M* (0.8) do not find the stock overvalued although in a different section M* has it at two stars and overvalued by 32%. Based on a mere 3-year history, Relative Value [(current P/E) / 5-year-mean average P/E] is extremely high at 1.55. “Quick and Dirty DCF” calculates stock overvalued by ~28%.
This is a volatile stock with an inconsistent track record and unpredictable service/product demand as suggested by M*. I do believe lower quality can be offset by larger MOS, however, and this study has it.
Per U/D, VRT is a BUY under ~$110/share. BetterInvesting® TAR criterion would be met [262.8 / ((14.77 / 100 ) +1 ) ^ 5]
~ $132 given a forecast high price ~$263.
A 90-day free trial to BetterInvesting® may be secured here (also see link under “Pages” section at top right of this page).
Categories: BetterInvesting® | Comments (0) | PermalinkV Stock Study (2-17-26)
Posted by Mark on July 31, 2025 at 07:27 | Last modified: February 17, 2026 10:09I recently did a stock study on Visa Inc. (V, $314.08). Previous studies are here and here.
M* writes:
> Visa is the largest payment processor in the world. In fiscal 2025, it
> processed almost $17 trillion in total volume. Visa operates in over
> 200 countries and processes transactions in over 160 currencies. Its
> systems are capable of processing over 65,000 transactions per second.
Over the past decade, this large-size company has grown sales and EPS at annualized rates of 10.6% and 16.7%, respectively [FY ends Sep 30]. Lines are mostly up, straight, and parallel except for sales+EPS dip in ’20. Shares outstanding decrease 24.1% (3.0% per year). Value Line (VL) gives an Earnings Predictability score of 95.
Over the past decade, PTPM leads peer and industry averages while increasing from 53.1% to 60.5% (’25) with last-5-year mean of 64.0%. ROE trails peer and industry averages despite increasing from 17.6% to 52.2% (’25) with last-5-year mean of 44.5%. Debt-to-Capital is far less than peer and industry averages despite increasing from 32.5% to 39.9% (’25) with last-5-year mean of 36.7%.
Quick Ratio is 0.73 and Interest Coverage is 42.1 per M* who assigns “Wide” Economic Moat, rates the company “Standard” for Capital Allocation, and gives an A grade for Financial Health (per BetterInvesting® website). VL rates the company A++ for Financial Strength and points out current cash on hand nearly covers long-term debt.
V is #3 on the “Top 40 Stocks Purchased by Investment Clubs” stock screen as of 2/10/26 (nod to the BetterInvesting® Weekly Update email).
With regard to sales:
- YF gives YOY ACE 12.0% and 13.1% [both percentages equal to below] for ’26 and ’27 (based on 34 analysts).
- Zacks gives YOY ACE 11.3% and 10.2% for ’26 and ’27, respectively (13 analysts).
- VL projects 7.8% annualized growth from ’25-’29.
- CFRA projects 2.0% YOY and 11.1% per year for ’26 and ’25-’27, respectively.
- M* offers a 2-year ACE of 10.8% and projects 10.5% per year from ’25-’30 (Equity Report).
I am forecasting below the range at 7.0% per year.
With regard to EPS:
- MarketWatch projects 12.3% and 12.5% per year for ’25-’27 and ’25-’28, respectively (based on 40 analysts).
- Nasdaq.com gives ACE 13.1% and 12.9%/year for ’26-’28 and ’26-’29 [17 / 9 / 1 analyst(s) for ’26 / ’28 / ’29].
- Seeking Alpha projects 4-year annualized growth of 13.1%.
- Finviz gives ACE 5-year annualized growth of 12.6% (8).
- LSEG estimates LTG at 13.1%.
- Argus projects 5-year annualized growth of 20.0%.
- YF gives YOY ACE 12.0% and 13.1% for ’26 and ’27, respectively (38) [something seems amiss as both equal to above].
- Zacks gives YOY ACE 11.9% and 13.3% for ’26 and ’27 (15) along with 5-year annualized growth of 13.6%.
- VL projects 7.7% annualized growth from ’25-’29.
- CFRA projects growth of 12.9% YOY and 13.1% per year for ’26 and ’25-’27 along with 3-year CAGR of 13.0%.
- M* gives long-term growth ACE of 14.2% and projects 13.1% from ’25-’30 in Equity Report.
My 8.0% forecast is near bottom of the long-term-estimate range (mean of eight: 13.4%). Initial value is ’25 EPS of $10.20/share instead of 2026 Q1 EPS $10.66 (TTM).
My Forecast High P/E is 30.0. Over the past 10 years, high P/E ranges from 30.1 in ’24 to 44.9 in ’21 with last-5-year mean of 35.2 and a last-5-year-mean average P/E of 30.4. I am below the range.
My Forecast Low P/E is 23.0. Over the past 10 years, low P/E ranges from 21.1 in ’23 to 31.8 in ’21 with last-5-year mean of 25.6. I am forecasting near bottom of the range (only ’23 is less).
My Low Stock Price Forecast (LSPF) of $234.60 is default based on initial value above. This is 25.3% less than the previous close and 21.5% less than the 52-week low.
Over the past 10 years, Payout Ratio (PR) ranges from 18.7% in ’18 to 24.5% in ’20 with a last-5-year mean of 22.1%. I am forecasting below the range at 18.0%.
These inputs land V in the HOLD zone with a U/D ratio of 1.7. Total Annualized Return (TAR) is 8.0%.
PAR (using Forecast Average—not High—P/E) of 5.5% is less than I seek from a large-size company. If a healthy margin of safety (MOS) anchors this study, then I can proceed based on TAR instead albeit still less than desired.
To assess MOS, I compare my inputs with those of Member Sentiment (MS). Based on 563 studies done in the past 90 days (191 outliers including mine excluded), averages (lower of mean/median) for projected sales growth, projected EPS growth, Forecast High P/E, Forecast Low P/E, and PR are 10.3%, 11.9%, 32.4, 24.8, and 21.9% respectively. I am lower across the board. VL [M*] projects a future average annual P/E of 28.0 [17.0, which once again seems unreasonably low] that is [much] less than MS (28.6) and greater [much less] than mine (26.5).
MS high / low EPS are $18.14 / $10.21 versus my $14.99 / $10.20 (per share). My high EPS is less due to a lower growth rate. VL [M*] high EPS of $15.45 [$17.70] is in the middle.
MS LSPF of $257.20 implies a Forecast Low P/E of 25.2 versus the above-stated 24.8. MS LSPF is 1.6% greater than the default $10.21/share * 24.8 = $253.21 that results in more aggressive zoning. MS LSPF is 9.6% greater than mine.
MOS is robust in the study because my inputs are near or below historical/analyst/MS averages/ranges. Also backing this assessment are MS TAR exceeding mine by 5.0% per year and a greater LSPF.
With regard to valuation, PEG is 1.8 and 3.4 per Zacks and my projected P/E: slightly overvalued (2.2 per M* for ’25). Relative Value [(current P/E) / 5-year-mean average P/E] is fair at 0.97. “Quick and Dirty DCF” has stock overvalued by 7.1%.
Per U/D, V is a BUY under ~$288/share. BetterInvesting® TAR criterion would be met [449.7 / ((14.27 / 100 ) +1 ) ^ 5]
~ $231 given a forecast high price ~$450.
A 90-day free trial to BetterInvesting® may be secured here (also see link under “Pages” section at top right of this page).
Categories: BetterInvesting® | Comments (0) | PermalinkAAPL Stock Study (2-15-26)
Posted by Mark on July 28, 2025 at 07:21 | Last modified: February 17, 2026 09:07I recently did a stock study on Apple Inc. (AAPL, $255.78).
M* writes:
> Apple is among the largest companies in the world, with a broad portfolio
> of hardware and software products targeted at consumers and businesses.
> Apple’s iPhone makes up a majority of the firm sales, and Apple’s other
> products like Mac, iPad, and Watch are designed around the iPhone as the
> focal point of an expansive software ecosystem. Apple has progressively
> worked to add new applications, like streaming video, subscription
> bundles, and augmented reality. The firm designs its own software and
> semiconductors while working with subcontractors like Foxconn and
> TSMC to build its products and chips. Slightly less than half of Apple’s
> sales come directly through its flagship stores, with a majority of
> sales coming indirectly through partnerships and distribution.
Over the past decade, this mega-size (> $100B annual revenue) company has grown sales and EPS at annualized rates of 8.2% and 16.1%, respectively [FY ends Sep 30]. Lines are mostly up, straight, and parallel except for sales dips in ’19 and ’23 and EPS dips in ’19 and ’24. Shares outstanding decrease 31.8% (4.2% per year). Five-year EPS R^2 is 0.72 and Value Line (VL) gives an Earnings Predictability score of 85.
Over the past decade, PTPM trails peer/industry [lines have identical morphology and practically overlay each other for all three metrics] averages while ranging from 24.4% in ’20 to 31.9% in ’25 with last-5-year mean of 30.7%. ROE also trails peer/industry averages despite increasing from 35.0% to 167% (’25) with last-5-year mean of 155% (far above industry standards due to aggressive share buyback program per GoogleAI). Debt-to-Capital is less than peer/industry averages despite increasing from 40.4% to 57.2% (’25) with last-5-year mean of 65.9%.
Quick Ratio is 0.85 and Interest Coverage N/A per M* who assigns “Wide” Economic Moat, gives an A grade for Financial Health (per BetterInvesting® website), and rates the company “Exemplary” for Capital Allocation [I’m surprised M* is complimentary of share buyback program because doing so over a long time horizon while having VL Price Growth Persistence score of 100 implies costly expense for much of it: something M* detests]. VL rates the company A+ for Financial Strength.
With Interest Coverage unspecified, Cash Coverage Ratio may be calculated as an alternative metric. For 2025, GoogleAI has (CF from Operations) / Total Debt = $111.48B / $98.65B = 1.13: company generates more cash in one year to theoretically pay down its entire debt load.
AAPL is #2 on the “Top 40 Stocks Purchased by Investment Clubs” stock screen as of 2/10/26 (nod to the BetterInvesting® Weekly Update email for alerting me).
With regard to sales growth:
- YF gives YOY ACE 13.8% and 9.5% [both percentages equal to below] for ’26 and ’27 (based on 37 analysts).
- Zacks gives YOY ACE 10.8% and 7.3% for ’26 and ’27, respectively (11 analysts).
- VL projects 6.3% annualized growth from ’25-’29.
- CFRA projects 11.6% YOY and 9.6% per year for ’26 and ’25-’27, respectively.
- M* offers a 2-year ACE of 8.3%. and projects 7.7% per year from ’25-’30 (Equity Report).
I am forecasting below the range at 6.0% per year.
With regard to EPS growth:
- MarketWatch projects 12.1% and 10.3% per year for ’25-’27 and ’25-’28, respectively (based on 51 analysts).
- Nasdaq.com gives ACE 2.6% and 13.8%/year for ’26-’28 and ’26-’29 [14 / 5 / 1 analyst(s) for ’26 / ’28 / ’29].
- Seeking Alpha projects 4-year annualized growth of 10.6%.
- Finviz gives ACE 5-year annualized growth of 11.2% (20).
- LSEG estimates LTG at 12.5%.
- Argus projects 5-year annualized growth of 13.0%.
- YF gives YOY ACE 13.8% and 9.5% for ’26 and ’27, respectively (38) [something likely amiss as both equal to above].
- Zacks gives YOY ACE 12.7% and 10.5% for ’26 and ’27 (13) along with 5-year annualized growth of 13.3%.
- VL projects 11.4% annualized growth from ’25-’29.
- CFRA projects growth of 14.6% YOY and 12.0% per year for ’26 and ’25-’27 along with 3-year CAGR of 10.0%.
- M* gives long-term growth ACE of 13.1% and projects 13.1% [puzzling duplication] from ’25-’30 in Equity Report.
My 10.0% forecast is below the long-term-estimate range (mean of eight: 12.3%). Initial value is ’25 EPS of $7.46/share instead of 2026 Q1 EPS $7.91 (TTM).
My Forecast High P/E is 27.0. Over the past 10 years, high P/E increases from 14.9 to 34.9 (’25) with last-5-year mean of 32.8 and a last-5-year-mean average P/E of 27.4. I am below the latter (and high P/E for each of last six years).
My Forecast Low P/E is 16.0. Over the past 10 years, low P/E increases from 10.8 to 22.7 (’25) with last-5-year mean of 22.0. I am forecasting below the last six years.
My Low Stock Price Forecast (LSPF) is $169.20. Default ($126.60) based on initial value above is unreasonably low at 50.5% less than the previous close and 25.2% less than the 52-week low. My (arbitrary) selection is the 52-week low itself: 33.8% less than the previous close.
Over the past 10 years, Payout Ratio (PR) has fallen from 26.2% to 13.7% (’25) with a last-5-year mean of 15.0%. I am forecasting below the range at 13.0%.
These inputs land AAPL in the HOLD zone with a U/D ratio of 0.8. Total Annualized Return (TAR) is 5.3%.
PAR (using Forecast Average—not High—P/E) of 0.8% is unthinkable as an investment candidate. If a healthy margin of safety (MOS) anchors this study, then I can proceed based on the 5.3% TAR albeit still lower than I seek for a mega-size company.
To assess MOS, I compare my inputs with those of Member Sentiment (MS). Based on 485 studies done in the past 90 days (159 outliers including mine excluded), averages (lower of mean/median) for projected sales growth, projected EPS growth, Forecast High P/E, Forecast Low P/E, and PR are 7.4%, 10.0%, 32.4, 21.9, and 15.0% respectively. I am equal on EPS growth and lower on the rest. VL [M*] projects a future average annual P/E of 31.0 [20.6] that is greater than MS (27.2) and greater [less] than mine (21.5).
MS high / low EPS are $12.28 / $7.30 versus my $12.01 / $7.46 (per share). VL [M*] high EPS of $11.50 [$12.39] is less [greater] than both.
MS LSPF of $169.20 implies a Forecast Low P/E of 23.2 versus the above-stated 21.9. MS LSPF is 5.8% greater than the default $7.30/share * 21.9 = $159.87 that results in more aggressive zoning. MS LSPF is equal to mine.
MOS is robust in the study because my inputs are near or below historical/analyst/MS averages/ranges. Also backing this assessment is MS TAR exceeding mine by 3.4% per year.
With regard to valuation, PEG is 2.3 and 2.9 per Zacks and my projected P/E: slightly overvalued (2.0 per M*). Relative Value [(current P/E) / 5-year-mean average P/E] is elevated at 1.18. “Quick and Dirty DCF” has stock undervalued by 11%.
Per U/D, AAPL is a BUY under $208/share. BetterInvesting® TAR criterion would be met [324.3 / ((14.37 / 100 ) +1 ) ^ 5]
~ $165 given a forecast high price ~$324.
A 90-day free trial to BetterInvesting® may be secured here (also see link under “Pages” section at top right of this page).
Categories: BetterInvesting® | Comments (0) | PermalinkQuality and Fundamentals (Part 7)
Posted by Mark on July 17, 2025 at 07:30 | Last modified: February 12, 2026 11:15Hello end of the tunnel! Today I conclude my series on Quality vs. fundamentals and what matters most for the SSG.
Two big conclusions stated last time answer the questions I set out to explore. First, the difference between high-quality stocks and good fundamentals may only be magnitude of [sales / EPS] growth and/or management metrics (i.e. PTPM, ROE, and Debt-to-Capital). Second, stocks with good earnings predictability—historically up, straight, and parallel—are necessary for the SSG methodology.
The reason I couldn’t end with Part 6 was Neff’s inclusion of “solid forecasted earnings growth.” This may not meet the BetterInvesting® criteria for high-quality growth stocks (not to mention high-flying P/E’s), but it’s certainly not “very little growth” as mentioned in the penultimate paragraph.
My prompt for Google AI was “can value investing involve low-quality stocks?” As it turns out, this concept dates all the way back to Benjamin Graham.
While contemporary value investing often prioritizes [high-] quality growth at a reasonable price, original Graham principles include strategies for buying “low-quality” or distressed assets if the price is sufficiently low to provide a significant margin of safety [MOS in my stock studies]. This is known by some as “deep value [cigar butt] investing.”
The relationship between quality and value typically falls into two distinct categories. Deep value involves buying stock in companies that may be low-quality or even in “retrogression” if they trade below net current asset [liquidation] value. Here, investors disregard traditional quality metrics in favor of extreme price discounts. The other category includes turnaround situations. In this case, investors look to buy stock in companies of low quality due to temporary setbacks, poor management, or industry cycles with hopes of return to higher quality status.
The risk of value trap applies to both categories where a stock appearing cheap based on metrics like P/E or P/B is actually fairly priced due to its deteriorating business.
The following performance graph provided does not include statistical [inferential] analysis for significance or more than 11 recent years but it’s a start:
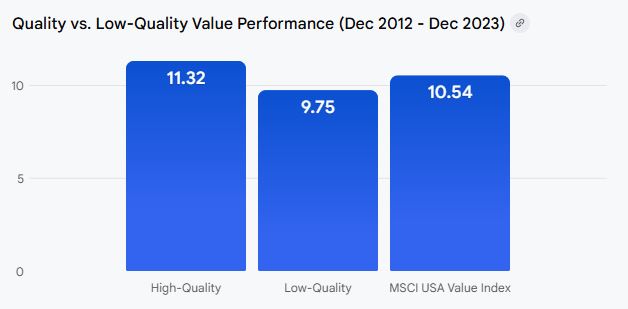
Although value investing with lower-quality stocks can provide return, the return may be lower and underperform benchmarks.
Different value investing philosophies treat “quality” differently:
- Traditional / modern value (Buffett / Munger) emphasizes high-quality companies with economic moats [competitive advantage] and eschews low-quality companies altogether.
- Graham’s defensive criteria recommend a minimum quality level such as S&P Earnings / Dividend Rating > B and at least 10 years of positive earnings.
- Deep value / contrarian specifically targets out-of-favor or distressed companies labeled by some as “junk.”
To help avoid value traps (permanently impaired low-quality stocks), heed these warning signs:
- Inconsistent profits in the form of frequent losses or “one-time” charges that recur.
- Companies with more debt than equity (or high Debt-to-Capital) are often considered lower quality and higher risk.
- “Cheap” prices in a dying / declining industry (e.g., legacy retail).
- Low share prices (especially < $5.00) can lead to reduced liquidity and higher volatility making recovery more difficult.
Onward and upward my fellow investors!
————————
A 90-day free trial to BetterInvesting® may be secured here (also see link under “Pages” section at top right of this page).
Quality and Fundamentals (Part 6)
Posted by Mark on July 14, 2025 at 07:28 | Last modified: February 10, 2026 11:24Now with a brighter light at end of the tunnel, let’s begin today by addressing the topic sentence from first paragraph Part 5.
The difference between high-quality [growth] stocks [numbered Learn to Earn criteria here and Manifest Investing criteria penultimate paragraph here] may only be magnitude of growth/sales and/or management metrics (i.e. PTPM, ROE, and Debt-to-Capital). Necessary for the SSG methodology are stocks with good earnings predictability: also known as R^2 and historically “up, straight, and parallel.”
Per my rebuttal in Part 1, I do not believe a company needs to be of high-quality in order to be a solid investment candidate.
In my view, much of the latter boils down to whether value investing is a viable approach. Performance numbers from Part 2 are supportive along with the new (Sep 2025) CEO of BetterInvesting® Wayne A. Thorp, CFA. Thorp has a long history of teaching and analyzing the value strategies found in John Neff on Investing (1999). In his previous AAII work, Thorp developed the video education series “Fundamental Stock Screen Strategies” detailing Neff’s methodology.
Thorp’s interpretation of Neff’s value approach emphasizes identifying stocks with specific fundamental characteristics:
- Low price-earnings (P/E) ratios
- Total Return ratio: (Estimated Earnings Growth + Dividend Yield) / (P/E). Neff seeks double the market average.
- Solid forecasted earnings growth
- Value investing is unfashionable, but Thorp points out Neff significantly outperforms S&P 500 over long periods.
While at AAII in Feb 2025 (also see “From the CEO” in Dec 2025 BetterInvesting® Magazine), Thorp published insights arguing that growth and value investing are not mutually exclusive in support of a “Growth at a Reasonable Price” mindset (GARP—term also used at BetterInvesting®). This curriculum is a core part of the AAII Essential Investing video course.
So whether “high-quality” (meeting the magnitude thresholds) or not, value can be successful. Google AI, Wayne Thorp, and John Neff (I just finished reading) all agree on this. Paul Merriman, of the Merriman Financial Education Foundation would also agree since he has done much work/advocacy for small-cap value.
Finally, value stocks may pose good entry diversification to high-quality growth stocks. I often see latter in the BUY zone only when the market has a pullback or following some company-specific bad news (even a rare poor/disappointing quarter or more). Value stocks are likely less impacted by bad news since they are soured upon already. I’ve seen cases where companies with very little growth hang out near or in the BUY zone for long periods of time waiting for a surprising upside catalyst.
I feel good about using the SSG methodology to study both high-quality growth and value stocks alike.
————————
A 90-day free trial to BetterInvesting® may be secured here (also see link under “Pages” section at top right of this page).
Quality and Fundamentals (Part 5)
Posted by Mark on July 11, 2025 at 11:35 | Last modified: February 9, 2026 14:57I continue today with my mini-series on the difference between high-quality stocks and solid fundamentals and what is necessary for the SSG methodology.
The second half of Part 4’s penultimate paragraph goes too far to imply that a history of consistent earnings [and/or sales since both ultimately go together] may actually be dangerous for picking good stocks. The bar chart suggests most companies have their day of reckoning but let’s remember the difference between concrete definition for Google AI and natural subjectivity inherent in the visual inspection. The first paragraph of my rebuttal mentions some stocks have data excluded to pass visual inspection [with many others being so inconsistent that even select omissions cannot save them]. Data exclusion is often due to nonrecurring items and makes good sense. Perhaps more importantly, over the course of 10 years many companies will have a slight YOY earnings dip(s) or more severe declines while still being “up, straight, and parallel” overall. The bar chart allows for none of this accomodation.
I also do believe some CEOs and management executives have the secret sauce when it comes to operating a company with consistent growth. Such laudable past performance likely continues into the future and a reckoning doesn’t mean an abrupt end to positive and consistently increasing numbers. The greatest stock market winners continue their runs for many years.
I think all of this is to say what matters most for the SSG methodology is historical consistency and the ability to pass visual inspection. We base studies on long-term growth estimates but for companies with low earnings predictability, the only confidence regarding said estimates is in their likelihood to be wrong and/or to fluctuate wildly over time.
To some degree, the SSG needs Quality [of which earnings predictability is a component] stocks but let’s realize magnitude is not part of the Part 3 discussion about consistently growing earnings. The door therefore remains open to value [low P/E] stocks as well as high-quality growth stocks [more likely to be high fliers].
And yes, companies can have good track records of growth and still be value stocks. They may be in mature or “unsexy” industries (e.g. utilities or consumer staples) that get overlooked. Given a long history of consistent [high] growth (earnings and dividends), they are [high-] quality value stocks due to a low P/E or P/B (book) relative to peers or the broader market. When a high-quality growth company has a temporary setback (e.g. bad earnings report, management change, out-of-favor industry) and suffers a stock correction, it may become a promising value play if the long-term growth story remains intact.
I will continue next time.
————————
A 90-day free trial to BetterInvesting® may be secured here (also see link under “Pages” section at top right of this page).
Quality and Fundamentals (Part 4)
Posted by Mark on July 8, 2025 at 07:31 | Last modified: February 8, 2026 12:17In Part 3, I revised the overriding question for this mini-series from whether quality and/or fundamentals are important for stock analysis and what the difference may be to what matters most for the stock study [guide, or SSG]?
Once answered, I can address the limitations of the SSG methodology itself. One thing I know already is that the methodology is not well-suited to stocks failing visual inspection.
Let’s go back to something else mentioned in Part 3: earnings predictability. This is one component to the Manifest Investing Quality rating. Value Line also gives an earnings predictability score for stocks covered in its Standard Edition. I have come to see earnings predictability as related to 5- and 10-year R^2 metrics.
The latter point suggests earnings predictabilty really caters to “up, straight, and parallel.” Financial wisdom dictates past performance does not guarantee future results but visual inspection says if a company has not been consistent (linear) in the past then we’re not giving it a chance to disappoint in the future. Only companies that have been consistent growers in the past are legitimate candidates for stock selection. This seems intuitive enough but does it really hold water?
The following bar chart from Google AI gets me concerned:
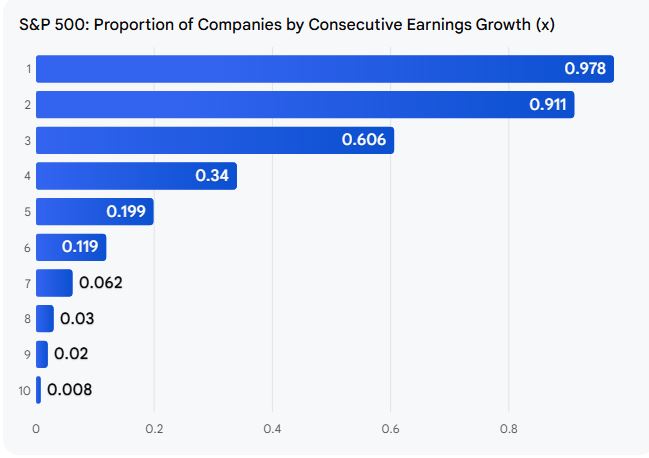
The number on the left (y-axis) is consecutive years of earnings growth. The chart shows that number inversely proportional to number (percentage) of S&P 500 companies. It therefore seems likely that the more consistent a company has been, the more likely it is to falter: the last thing we want because earnings decline often takes stock price with it.
The next big question is whether a faltering company is more likely to find its footing given a historical track record of consistent earnings growth. Once again, Google AI:
> Based on historical S&P 500 data, a company with a history of consistent
> earnings growth is slightly more likely to return to a path of consistent
> growth after an annual loss compared to companies without such a history.
> Specifically, companies with consistent past growth had a 58.3% probability
> of returning to consistent growth following a loss incident, while those
> without a consistent history had a 54.5% probability.
I am a bit skeptical for a few reasons. First, I don’t know if “history of consistent earnings growth” matches my concept. Also, it was unable to give me sample sizes for the 58.3% and 54.5% [I was hoping] nor was it able to give me a p-value on the difference [I did not expect]. Not seeing a larger difference may somewhat call into question the concept of quality management: a team with the secret sauce able to maintain the earnings consistency we seek. Certainly we wouldn’t want to be cherry-picking companies benefiting from random chance.
I will continue next time.
————————
A 90-day free trial to BetterInvesting® may be secured here (also see link under “Pages” section at top right of this page).