Weekly Iron Butterfly Backtest (Part 8)
Posted by Mark on July 3, 2013 at 04:14 | Last modified: August 2, 2013 14:20In this blog series, I’m backtesting the weekly option trade described here.
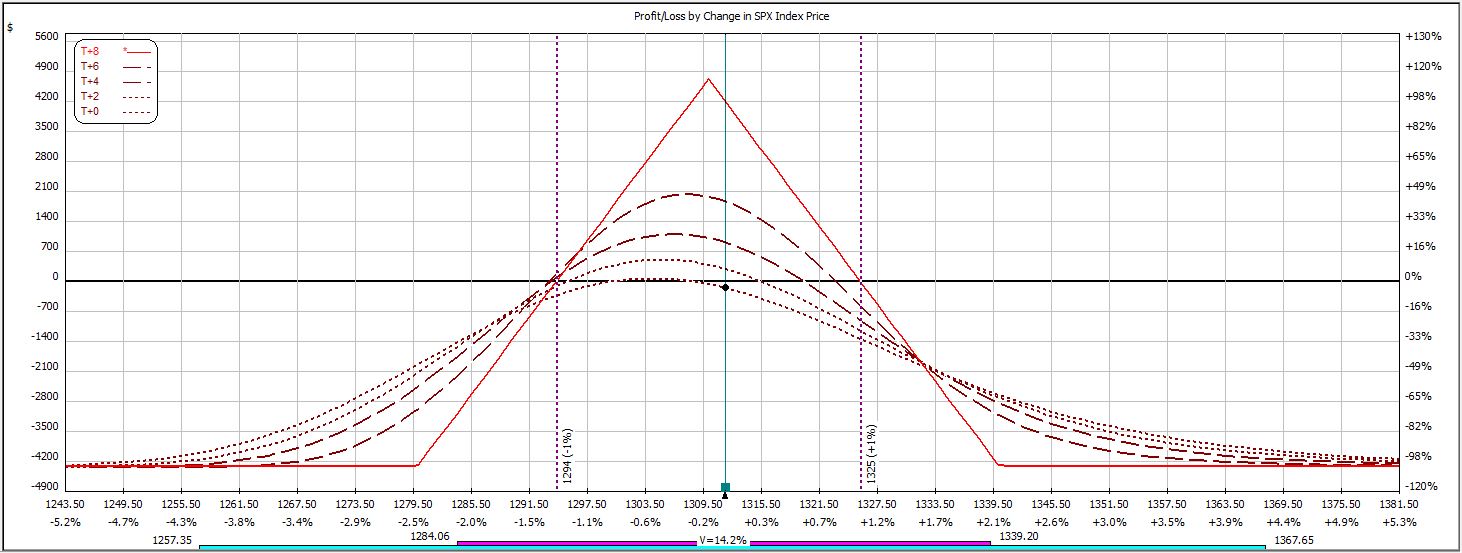
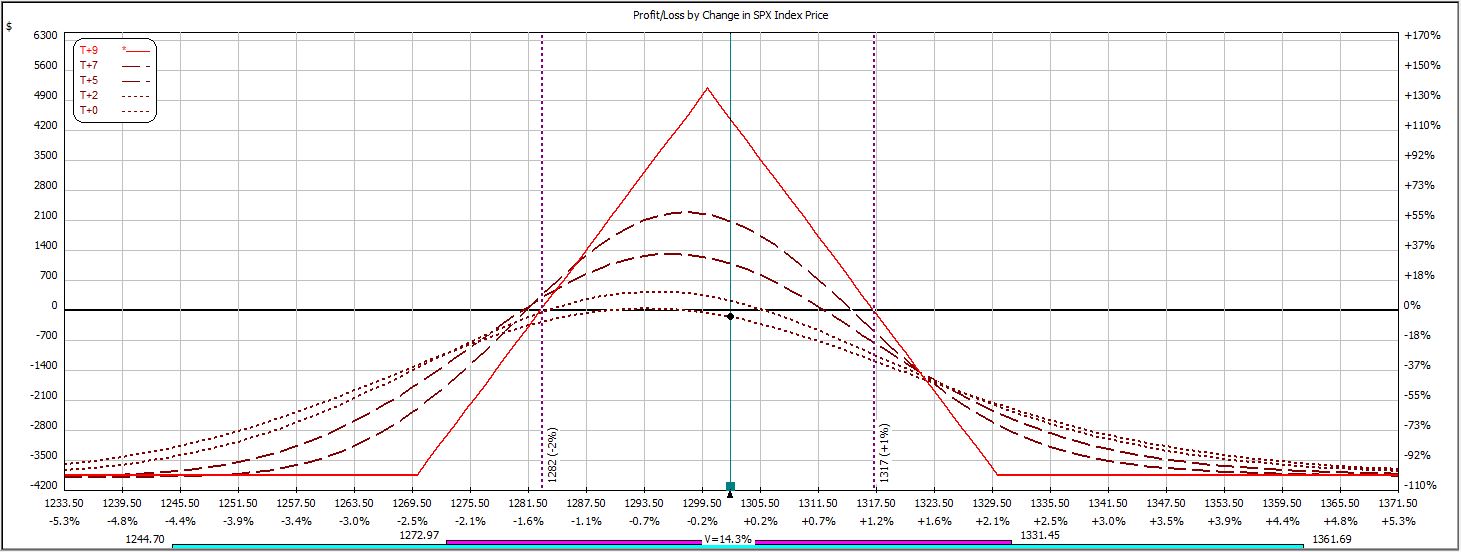
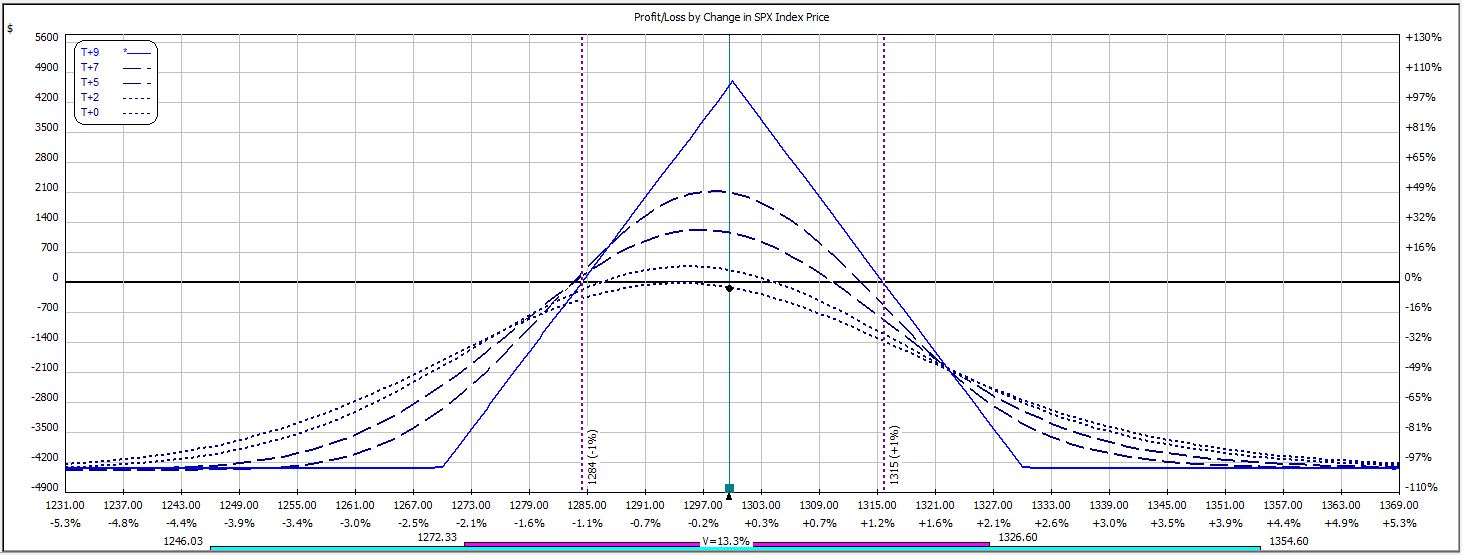
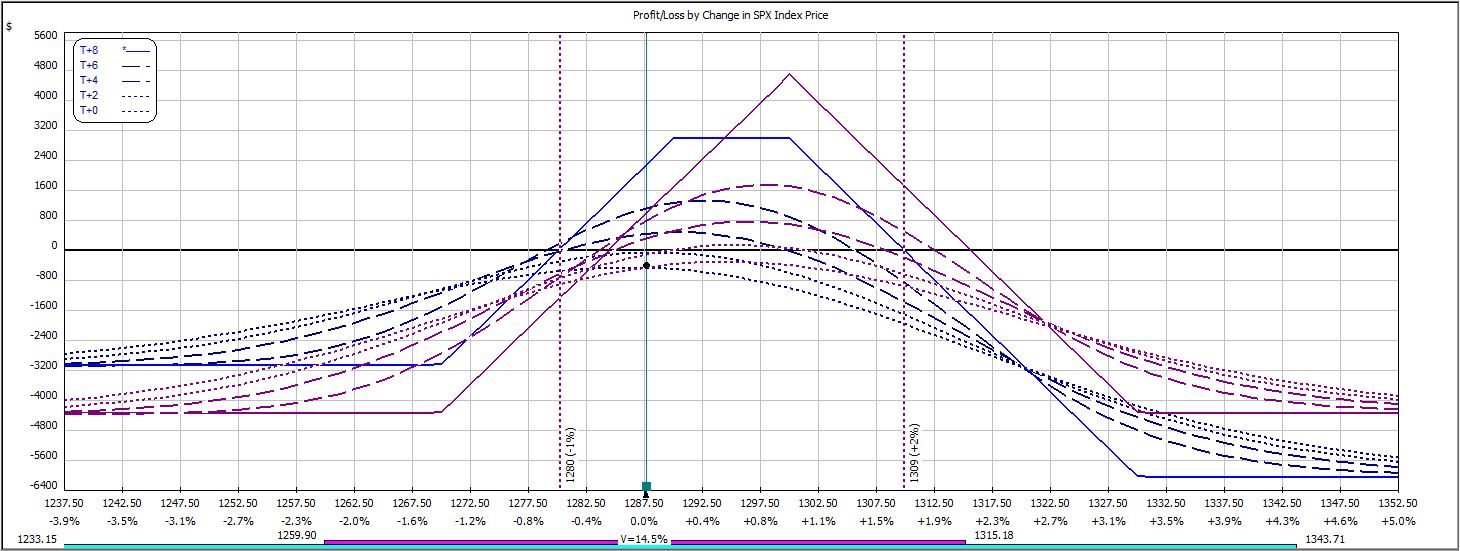
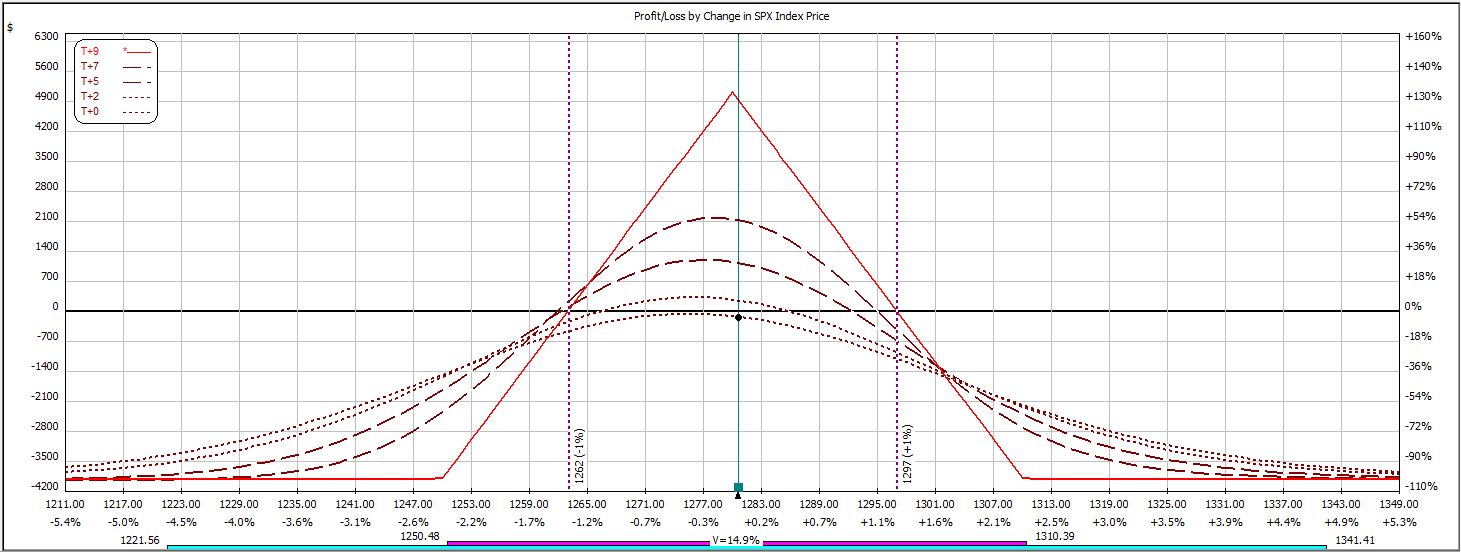
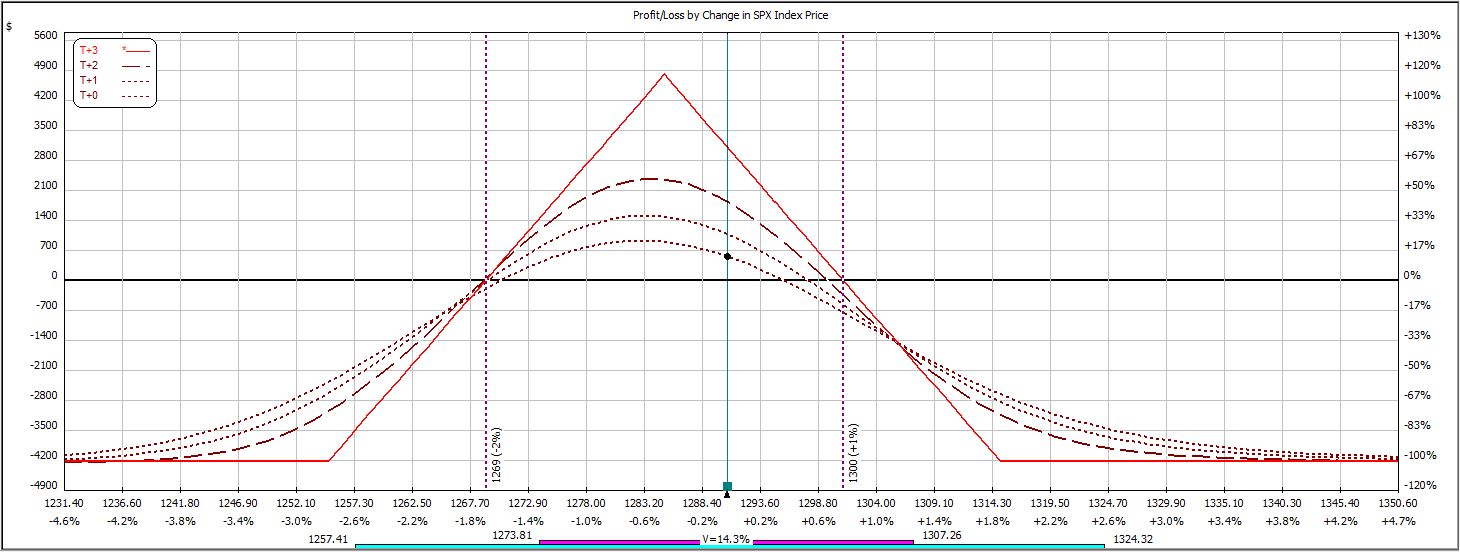
Week 7’s trade begins like this:
The trade closed just before the market sold off markedly:
P/L on Day 1 ranged from -$399 to -$114.
P/L on Day 2 ranged from -$75 to +$318.
Trade closed on Day 5 (nothing happened over the weekend) for a profit of $444, which is 10.1% on $4,419 initial margin.
In backtesting, this trade has now won four times in seven weeks.
Categories: Backtesting | Comments (0) | PermalinkWeekly Iron Butterfly Backtest (Part 7)
Posted by Mark on July 1, 2013 at 10:40 | Last modified: August 2, 2013 10:52In this blog series, I’m backtesting the weekly option trade described here.
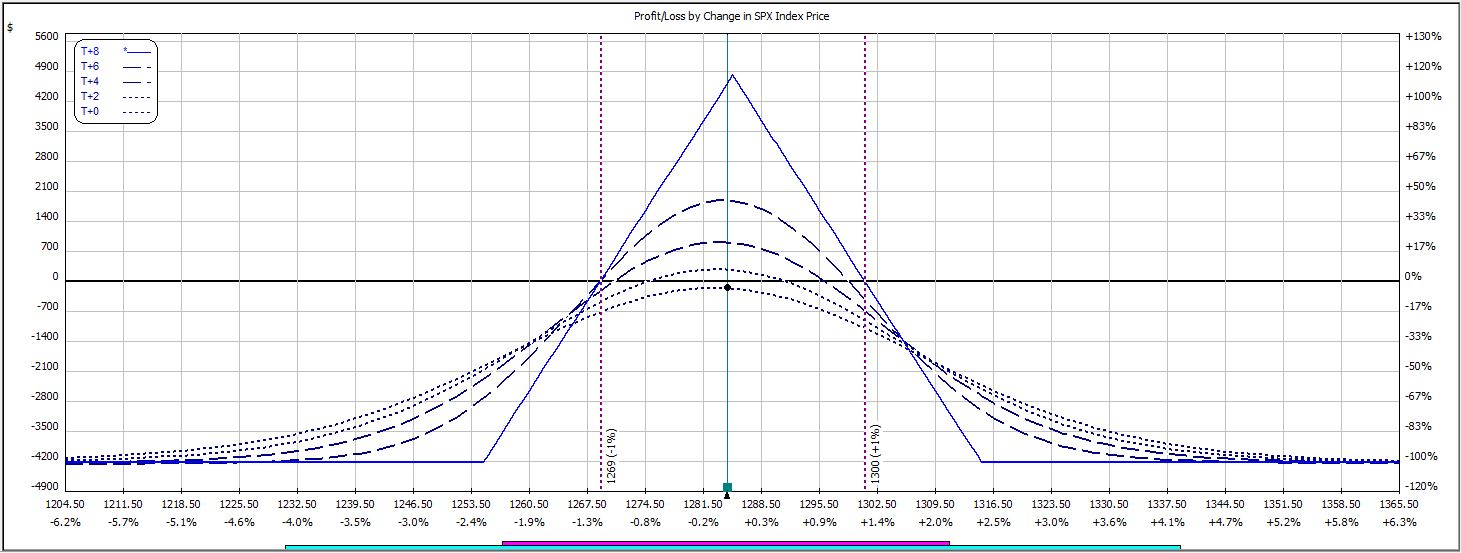
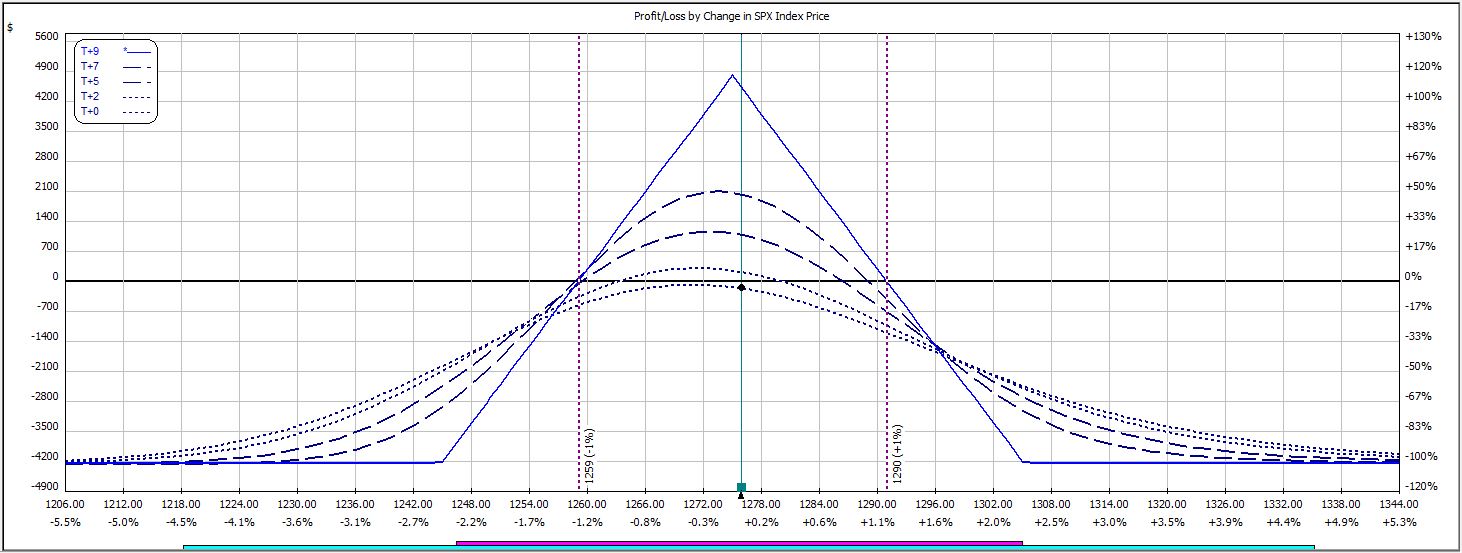
At inception on Week #6, the trade looked like this:
The P/L ranged from -$144 to -$837 on this day.
On Day #2, max loss was hit:
The market only had to rally 14 points to force a 26% loss on the initial margin of $4,311.
In the first six weeks of this backtest, we have seen three wins and three losses. That only tells half the story, however. The average win has been $515 versus an average loss of $1,032. That, my friends, is a recipe for disaster!
Time will tell whether these early tendencies persist.
Categories: Backtesting | Comments (0) | PermalinkWeekly Iron Butterfly Backtest (Part 6)
Posted by Mark on June 28, 2013 at 04:16 | Last modified: August 2, 2013 10:37In this blog series, I’m backtesting the weekly option trade described here.
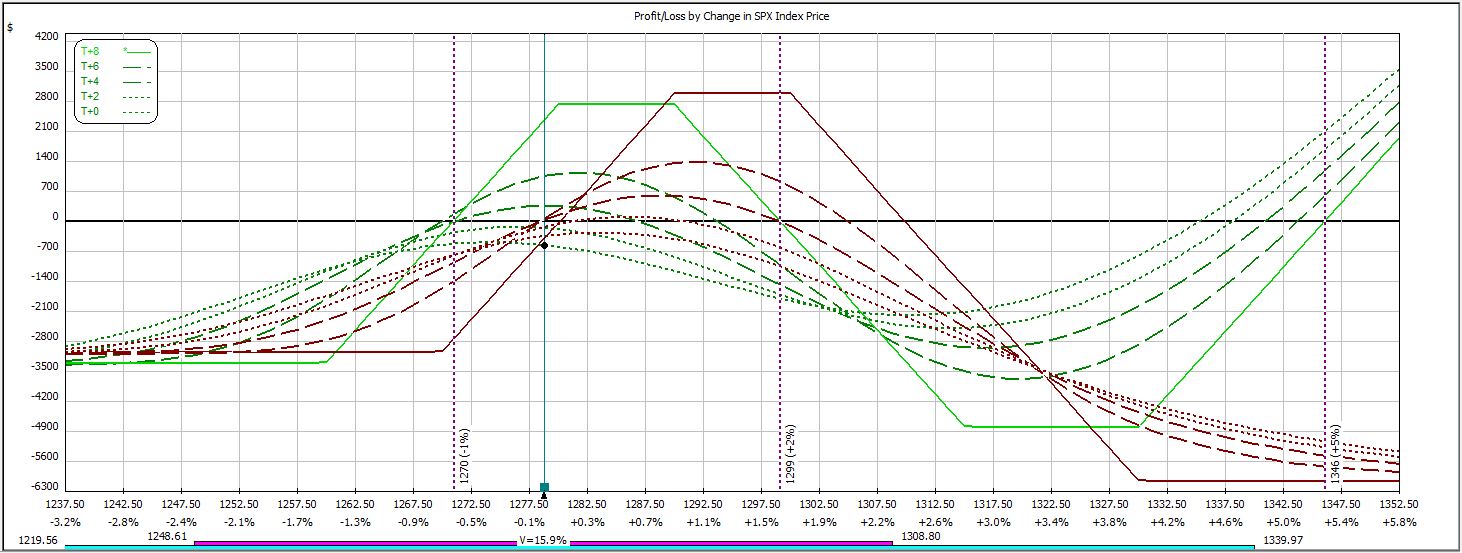
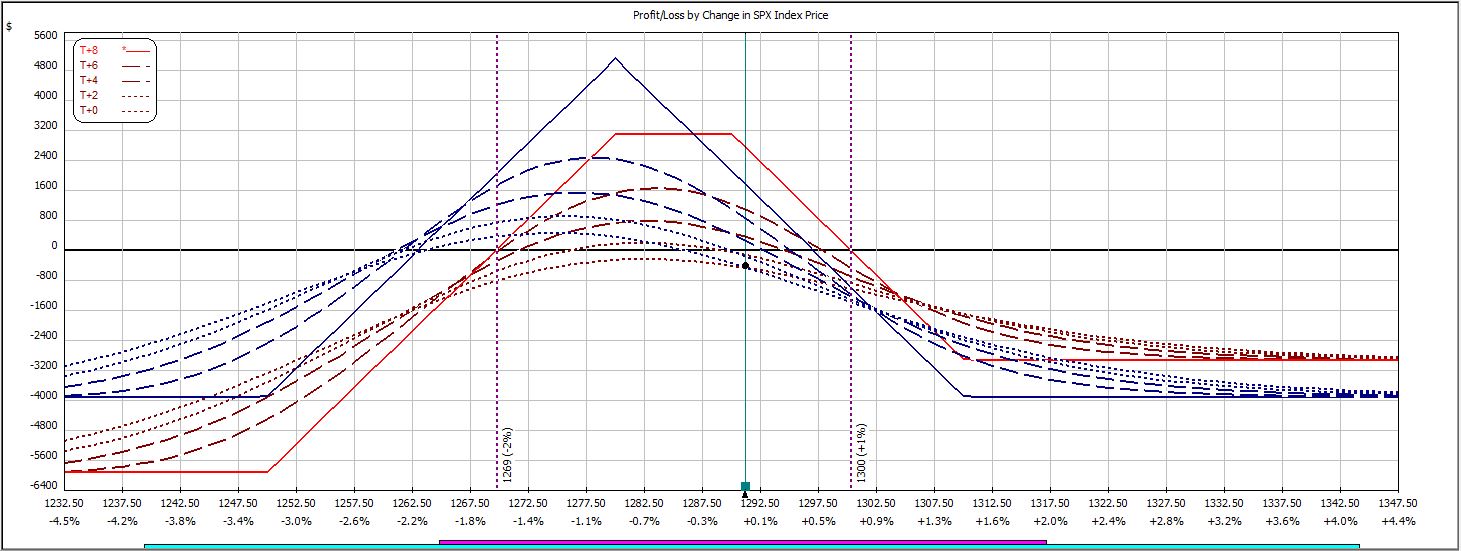
Week #5 is a loser. At inception, the trade looked like this:
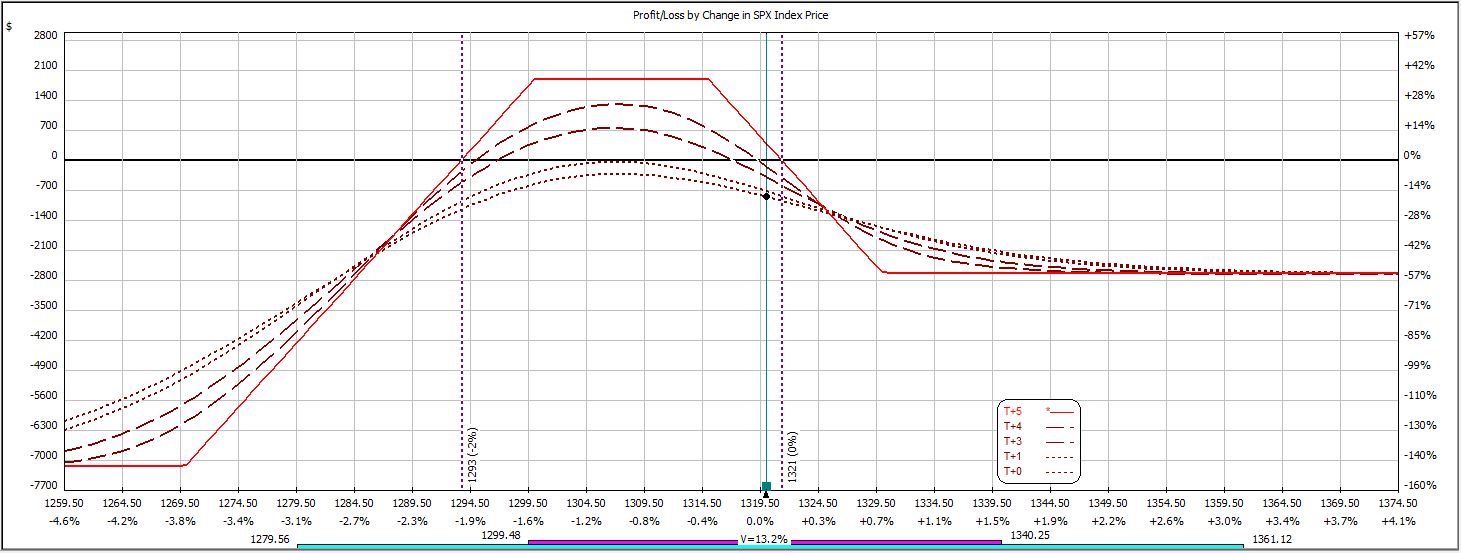
The market rallied 15 points to force an adjustment on Day #5. Shown in purple, I rolled the short calls up:
As the uptrend continued, max loss was hit soon after:
P/L on Day #1 ranged from -$177 to +$87 on $3,858 margin requirement for three contracts.
P/L on Day #2 ranged from -$90 to +$264.
P/L on Day #5 (nothing happened over the weekend) ranged from -$582 to -$837 (max loss), which is a loss of 11.7% on an adjusted margin requirement of $7,137.
In back-to-back weeks I have now seen sharp whippiness and strong trending cause this trade to lose. The win-loss record stands at 3-2.
Categories: Backtesting | Comments (0) | PermalinkWeekly Iron Butterfly Backtest (Part 5)
Posted by Mark on June 26, 2013 at 05:55 | Last modified: August 1, 2013 10:21In this blog series, I’m backtesting a weekly option trade described here.
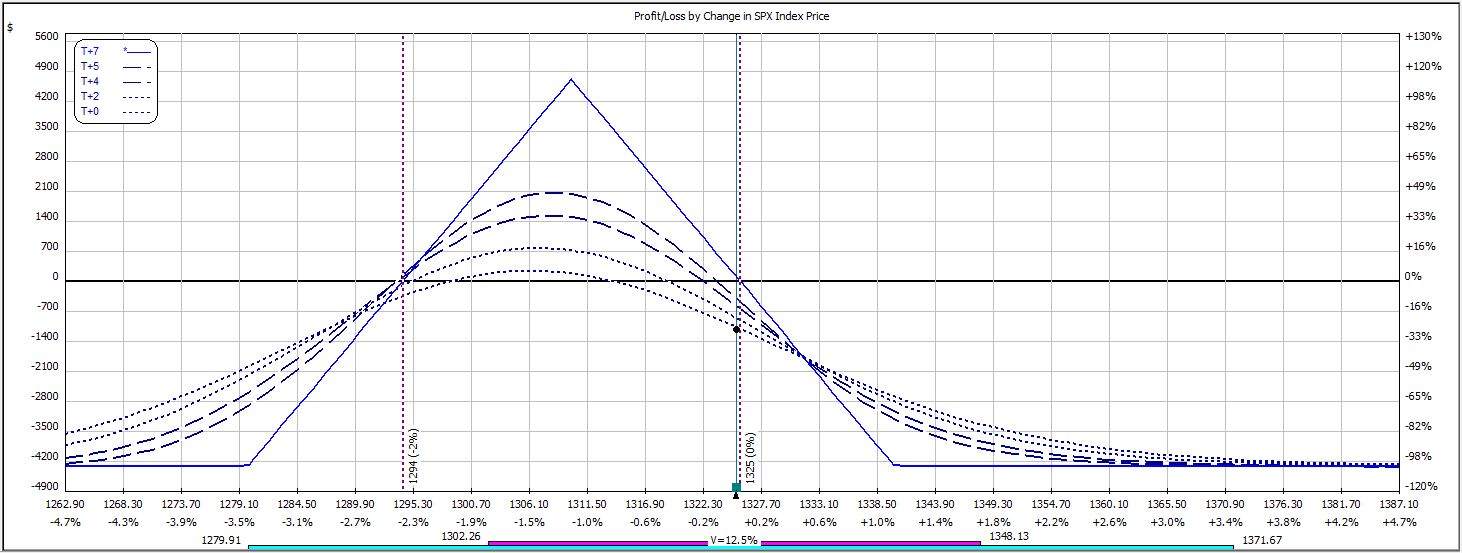
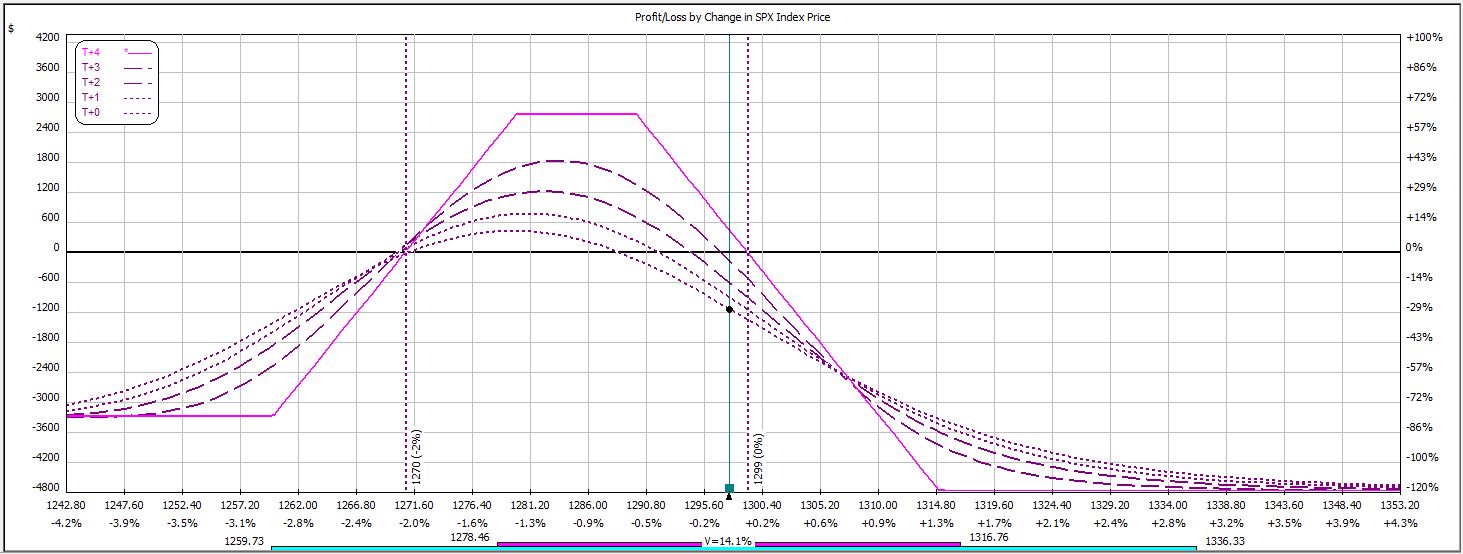
Week #4 presents the first loser of the bunch. At inception, the trade looked like this:
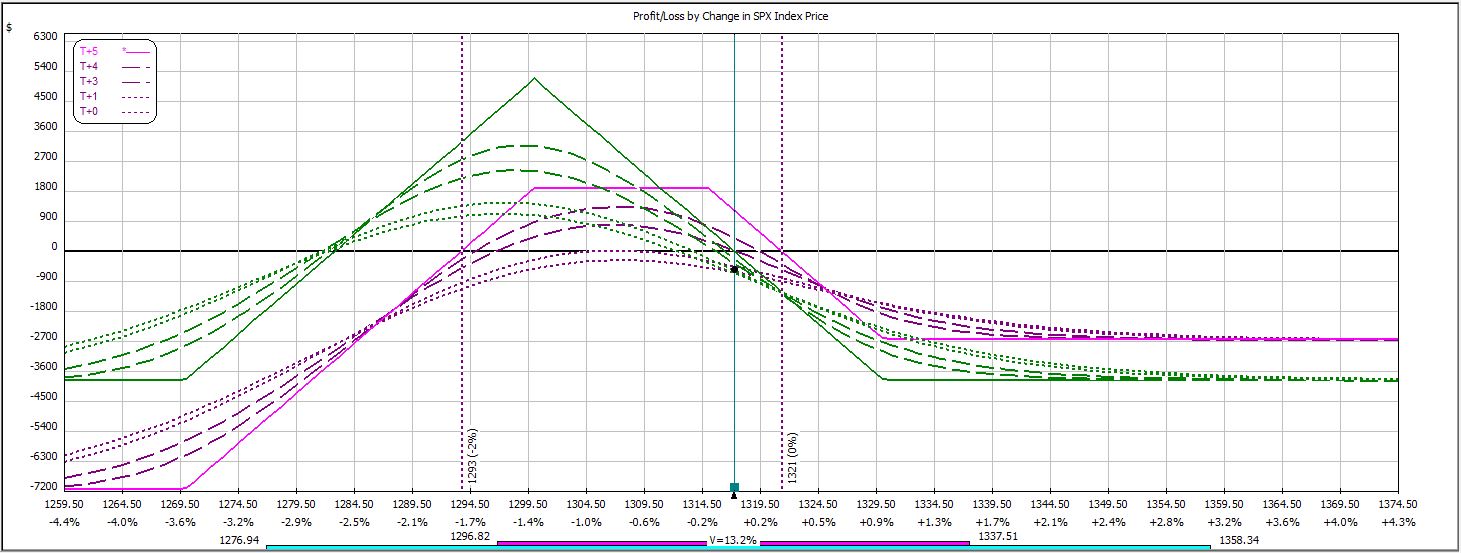
The market tanked on Day #2 forcing two adjustments. Adjustment #1 involved rolling down the short put 10 points. This is seen in blue:
Adjustment #2 involved rolling down the put spread, rolling the short call 10 points closer, and rolling the long call 15 points closer. This is seen below in green:
On the put side, although rolling the vertical rather than the short option alone increases downside risk, I had already cut downside risk with the previous adjustment. The net effect would leave downside risk roughly equivalent (in fact it was $3,276, which is still less than the original margin requirement).
On the call side, I rolled the short option closer to recoup some potential profit in the trade. I rolled the long option even closer to manage upside risk.
On Day #6, the market gapped higher forcing me to exit at max loss:
P/L on Day 1 ranged from -$387 to -$69.
P/L on Day 2 ranged from -$864 to +$102 and the margin requirement increased from $3,915 to $6,057 on three contracts.
P/L on Day 5 (nothing happened over the weekend) ranged from -$405 to -$234 on margin of $4,776.
Trade closed on Day 6 with a loss of $1,137, which is -18.8% on max margin.
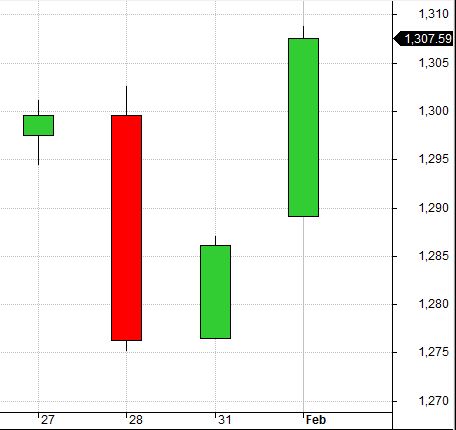
Relative to the first three weeks, the market was very whippy during the short time period. This trade will not win in the face of such price action:
The “$6M question” is whether this is the exception or the norm.
Categories: Backtesting | Comments (0) | PermalinkWeekly Iron Butterfly Backtest (Part 4)
Posted by Mark on June 24, 2013 at 07:42 | Last modified: August 1, 2013 07:57In this blog series, I’m backtesting a weekly option trade described here.
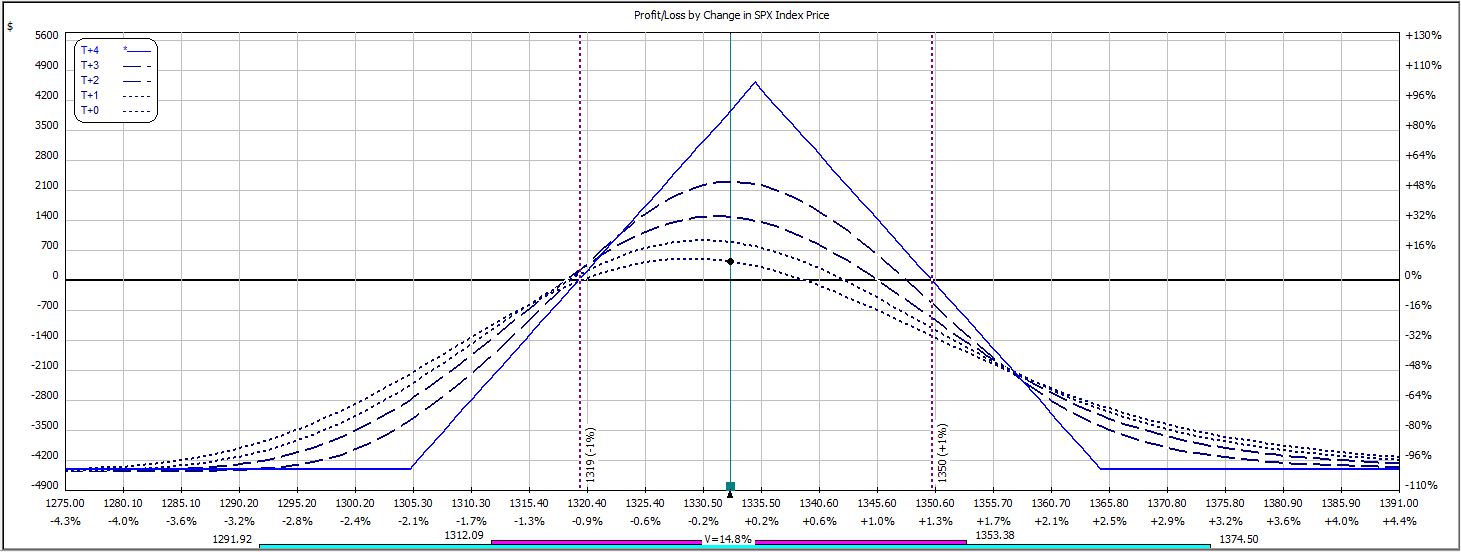
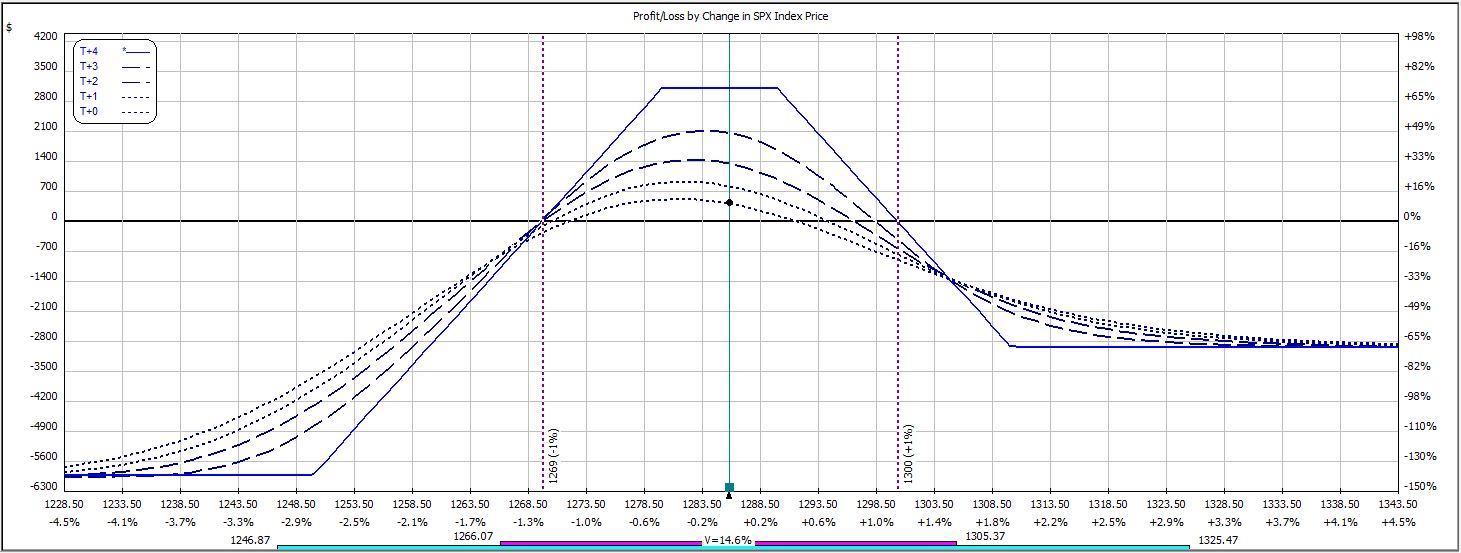
The third week required an adjustment. At inception, the trade looked like this:
The market was 10 points higher on Day 2, which required me to roll up the short call:
A discussion may be had whether to roll up the short call or the short call vertical spread. The former cuts net position delta while the latter does not increase risk as much. Although the former increase risk (margin requirement) more, that risk is on the profitable side of the trade. If the market continues to trend then the risk is actually less. This may be seen in the above graph that shows the adjusted trade superimposed on the original trade.
Which adjustment is better? That is a very difficult question to answer that would require extensive backtesting. I may be able to do that eventually for now I continue one week at a time.
P/L on Day 1 ranged from -$144 to +$39.
P/L on Day 2 ranged from -$426 to +$189 and the margin requirement increased from $3,915 to $5,931 on three contracts.
P/L on Day 5 (nothing happened over the weekend) ranged from +$72 to +$216.
P/L on Day 6 ranged from $237 to $447, which is when I closed the trade:
On the increased margin, return on investment was 7.5% on this trade.
Another question for debate is what to do if the market returns to its original price after rising or falling 10 points and forcing an adjustment: undo the adjustment or let it ride? This is another question that cannot be answered yet. The current trade does suggest, however, that adjustment requires staying in the trade longer to reach profit target. That makes theoretical sense.
Thus far, this trade has three wins and zero losses.
Categories: Backtesting | Comments (0) | PermalinkWeekly Iron Butterfly Backtest (Part 3)
Posted by Mark on June 21, 2013 at 07:09 | Last modified: August 1, 2013 07:40In this blog series, I’m backtesting a weekly option trade described here.
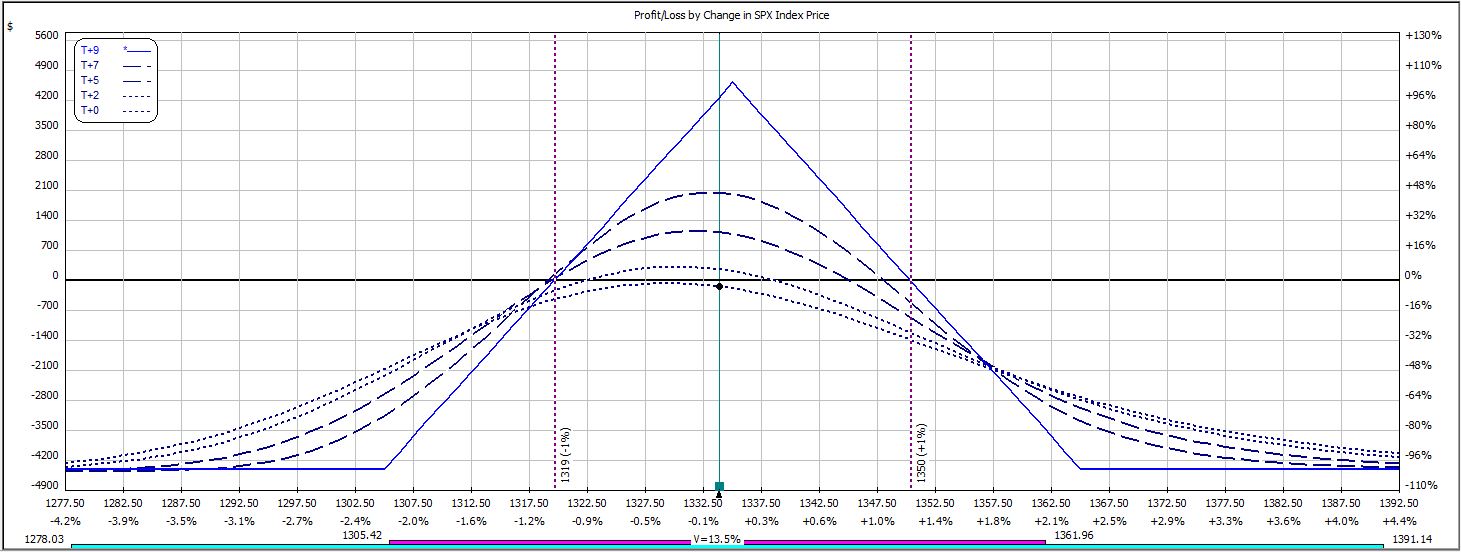
The second week was flawless. At inception, the trade looked like this:
P/L on Day 1 ranged from -$114 to +$78.
P/L on Day 2 ranged from +$87 to +$324.
P/L on Day 6 (nothing happened over the weekend or on MLK day) was $570, which is when I closed the trade:
No adjustments were required for this trade.
Margin remained constant at $4,230 for three contracts. Return on investment was 13.5%.
Thus far, this trade has two wins and zero losses.
Categories: Backtesting | Comments (0) | PermalinkWeekly Iron Butterfly Backtest (Part 2)
Posted by Mark on June 19, 2013 at 06:53 | Last modified: August 1, 2013 07:40In this blog series, I’m backtesting a weekly option trade described here.
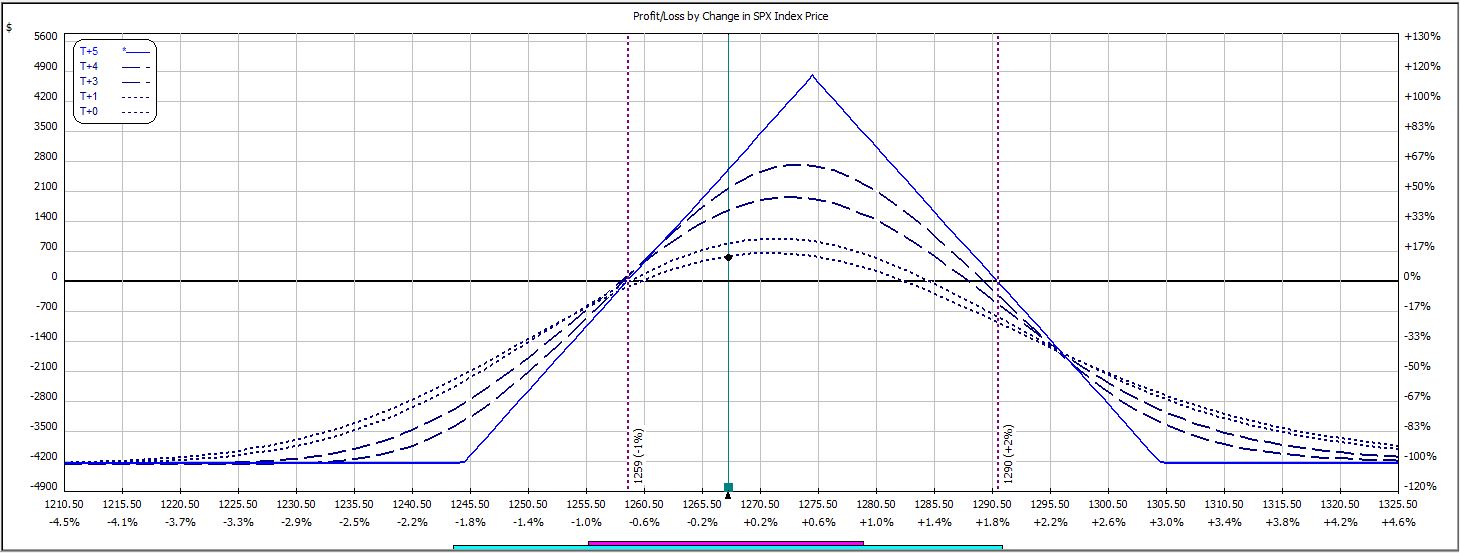
The first week was flawless. At inception, the trade looked like this:
P/L on Day 1 ranged from -$237 to -$12.
P/L on Day 2 ranged from +$18 to +$333.
P/L on Day 5 (nothing happened over the weekend) ranged from +$123 to +$528. The latter included allowing the long call to expire worthless since it was listed at $0.15 upon trade close, which looked like this:
No adjustments were required for this trade. While the market was over 10 points from its starting point on Day 5, since the trade was still profitable I did not adjust.
Margin remained constant at $4,236 for three contracts. Return on investment was 12.5%.
Categories: Backtesting | Comments (0) | PermalinkWeekly Iron Butterfly Backtest (Part 1)
Posted by Mark on June 17, 2013 at 06:10 | Last modified: August 1, 2013 08:23With this post, I’m going to start backtesting a weekly iron butterfly trade. I have been hearing from a number of traders that when traded every week, this can generate an average profit of 3-5%. My skepticism reigns supreme.
My trading plan will be as follows:
–Enter trade at the money on Thursday before expiration week.
–Target 10% profit on initial capital and keep max loss at 20%.
–If market rallies 10 points from initial price then roll out distressed short option by 10 points.
–If market moves another 10 points in the same direction then repeat adjustment or roll entire spread.
–Also at second adjustment, roll profitable vertical closer to the money to manage margin requirement.
–Do not adjust if P/L is positive.
–Assess transaction costs of $6/contract.
Hopefully I will be out of most trades by Monday or Tuesday of expiration week.
I have backtested this before using $16/contract transaction fees and gotten terrible results. I realize $16/contract is harsh. When it comes to transaction costs in backtesting though, I usually spare no potential expense because this is a great way to make a trade seem more profitable than it really can be.
As I said, I’ve heard a number of other traders say this works.
Traders lie.
Could I be missing out on a good thing by being too skeptical?
Here’s to second chances!
Categories: Backtesting | Comments (1) | PermalinkTruth in Backtesting (Part 10)
Posted by Mark on December 28, 2012 at 05:36 | Last modified: December 11, 2012 05:21In http://www.optionfanatic.com/2012/12/27/truth-in-backtesting-part-9/, I discovered that trading the CDC on S&P 500 stocks may require holding up to 235-250 stock positions at any one time. With this discovery, I am finally starting to gather some truth in backtesting.
To be prepared for a more extreme future, I want to budget for 300. At some point the markets will present a more extreme case than anything seen in the 33 years of backtesting–it’s just a matter of when. Truth in backtesting: if I cannot manage 300 open positions then this system is untradable for me.
The next question regards what initial account equity I need to preserve system performance. In #21478, I cut initial equity to $3M and only got 41,477 trades rather than 41,710. That’s too large of a cut. In #21479, I went up to $30M and got the 41,710 trades back. I was able to preserve performance with initial equity as low as $10M. Truth in backtesting: if my account isn’t at least $10M in size then I should not expect to see the kind of performance recorded in this backtest.
Perhaps I can further cut initial account equity by taking only long trades. Out of 41,710 trades, 26,711 trades are long. Cutting max open positions doesn’t help. Cutting initial equity to $5M also reduces total trades so that doesn’t help.
Can I cut initial account equity by decreasing position size? In #21497 I reduce position size from $100K to $10K, which not only decreases total trades but also PF from 1.48 to 1.36. With initial equity of $5M and a $50K position size, the long-only PF is 1.46–still a bit lower than 1.48.
I’ll make some concluding remarks in my next post.
Categories: Backtesting, System Development | Comments (1) | PermalinkTruth in Backtesting (Part 9)
Posted by Mark on December 27, 2012 at 03:50 | Last modified: December 7, 2012 18:41I have been describing a layperson’s approach to trading the CDC system on S&P 500 stocks. http://www.optionfanatic.com/2012/12/26/truth-in-backtesting-part-8/ got me to the point where I was encouraged by the system. Now, I need to better understand system exposure.
The truth in backtesting (or lack thereof) exists in the consistency between live trading and tacit backtesting assumptions. Although the backtesting says trading this system could generate a PF of 1.48 for long trades, as written the system requires an account size of $50M and the ability to manage 500 open positions. These are no-can-do for me. Were I to try and execute this system right now then I could expect great difference in live trading performance from that seen in backtesting. Better or worse? Probably worse. This is how markets work and I would be foolish to take a gamble on it.
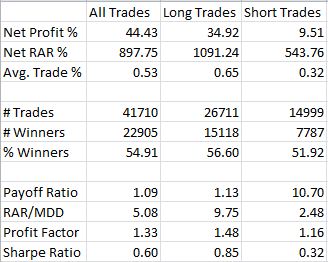
To pin down actual exposure, I first must determine how many open positions the system may require. Were I more skilled at programming then I could code AmiBroker to chart the number of open positions over time. Since I am not, my solution is to decrease the maximum number of allowable open positions in subsequent backtests and watch to see when the performance statistics begin to change. Here are the baseline performance statistics for backtest #21471, which includes the 200-MA filter but not the BB filter:
In backtests #21472 and #21473, I reduced the max number of open positions to 400 and 300 with no change in performance statistics. This tells me no more than 300 open positions were ever seen in the backtest. I was subsequently able to narrow this down between 235-250.
I will continue the analysis in my next post.
Categories: Backtesting, System Development | Comments (1) | Permalink