BSX Stock Study (5-12-26)
Posted by Mark on April 30, 2026 at 07:49 | Last modified: May 12, 2026 10:39I recently did a stock study on Boston Scientific Corp. (BSX, $53.37).
M* writes:
> Boston Scientific produces less invasive medical devices that
> are inserted into the human body through small openings
> or cuts. It manufactures products for use in angioplasty,
> blood clot filtration, kidney stone management, cardiac
> rhythm management, catheter-directed ultrasound imaging,
> upper gastrointestinal tract diagnostics, interventional
> oncology, neuromodulation for chronic pain, and treatment
> of incontinence. The firm markets its devices to healthcare
> professionals and institutions globally. Foreign sales
> account for roughly 36% of the firm’s total sales.
Over the past decade, this large-size company grows sales and EPS at annualized rates of 9.2% and 20.8%, respectively. Lines are up, straight, and parallel since 2022 but a bit “wonky” before that. I am excluding 2020 from the full analysis due to negative EPS (massive reduction in elective procedures due to COVID-19). 2019 EPS shows a massive boost due to a deferred tax benefit from internal transfer of assets (intellectual property) between legal entities. The adjusted EPS line is much smoother, increasing every year except ’20 at an average rate of 11.9%. Five- (10-) year EPS R^2 is 0.76 (0.29) and Value Line (VL) gives an Earnings Predictability score of 75. Shares outstanding increase 8.5% (0.9%/year).
Over the past decade, PTPM trails peer and industry averages despite increasing from 2.1% to 16.9% (’25) with a last-5-year mean of 12.5%. ROE trails peer and industry averages while increasing from 5.3% to 12.3% (’25) with a last-5-year mean of 7.8% (shareholder equity positive and consistently growing). Debt-to-Capital is less than peer and industry averages while falling from 44.9% to 32.1% (’25) with a last-5-year mean of 34.0%.
Quick Ratio is 0.98 and Interest Coverage 11.5 per M* who assigns “Narrow” Economic Moat, “Standard” rating for Capital Allocation, and a B grade for Financial Health (per BetterInvesting® website). VL rates the company A for Financial Strength.
With regard to sales growth:
- YF gives YOY ACE 8.0% and 8.9% for ’26 and ’27 (based on 28 analysts).
- Zacks gives YOY ACE 8.0% and 8.9% for ’26 and ’27, respectively (11 analysts).
- VL gives 5.3% per year from ’25-’30.
- CFRA gives ACE 8.6% YOY and 10.7% per year for ’26 and ’25-’27, respectively.
- M* gives 2-year ACE of 9.1% per year and projects 5-year annualized 8.4% in Equity Report.
I am forecasting below the range at 5.0% per year.
With regard to EPS growth:
- MarketWatch projects 13.7% and 13.6% per year for ’25-’27 and ’25-’28, respectively (based on 37 analysts).
- Nasdaq.com gives ACE 10.5% and 10.4% per year for ’26-’28 and ’26-’29 (13 / 6 / 3 analysts for ’26 / ’28 / ’29).
- Seeking Alpha projects 4-year annualized of 15.4%.
- Finviz gives ACE 5-year annualized of 11.4% (8).
- Argus gives 5-year annualized of 10.0%.
- LSEG projects LTG of 10.8%.
- YF gives YOY ACE 10.4% and 11.4% for ’26 and ’27, respectively (29).
- Zacks gives YOY ACE 10.5% and 11.0% for ’26 and ’27, respectively, and 5-year annualized of 16.2% (13).
- VL gives 6.8% annualized from ’25-’30.
- CFRA projects 11.1% YOY and 14.9% per year for ’26 and ’25-’27 along with 3-year CAGR of 13.0%.
- M* gives ACE long-term 24.6%/year but projects 9.2% annualized [adjusted] from ’25-’30 in Equity Report.
My 6.0% forecast is below the long-term-estimate range (mean of eight: 13.1%). Initial value is ’25 EPS of $1.94/share rather than 2026 Q1 $2.39 (TTM).
My Forecast High P/E is 35.0. Since 2018 (excluding near-triple-digit values or higher: 99.2 in ’16, 374 in ’17, and 107 in ’22), high P/E increases from 33.1 to 56.4 (’25) with a last-5-year mean of 62.9 and last-5-year-mean average (excluding same three years for low) P/E of 54.1. I am below all but 14.0 in ’19 and 33.1 in ’18.
My Forecast Low P/E is 21.0. Since 2018 (same years excluded as above), low P/E increases from 20.9 to 44.3 (’25) with a last-5-year mean of 45.4. I am forecasting near bottom of the range (9.8 in ’19 and 20.9 in ’18 are less).
My Low Stock Price Forecast (LSPF) of $40.70 is based on initial value from above. That is 23.7% less than previous close and 23.4% less than the 52-week low.
These inputs land BSX at cusp of the BUY zone with a U/D ratio of 3.0. Total Annualized Return (TAR) is 11.3%.
PAR (using Forecast Average—not High—P/E) of 6.4% is less than I seek for a large-size company. If a healthy margin of safety (MOS) anchors the study, then I can proceed based on TAR instead.
To assess MOS, I start by comparing my inputs with those of Member Sentiment (MS). Based on 105 studies done in the past 90 days (38 outliers excluded including mine), averages (lower of mean/median) for projected sales growth, projected EPS growth, Forecast High P/E, and Forecast Low P/E are 9.6%, 13.8%, 40.0, and 30.0, respectively. I am lower across the board. VL [M*] projects a future average P/E of 25.0 [11.5, which seems unreasonably low]: less than MS (35.0), less than mine (28.0), and less than its own previous quarterly report (32.0).
MS high / low EPS are $3.90 / $1.94 versus my $2.60 / $1.94 (per share). My high EPS is less due to a lower growth rate. VL (M*) high EPS of $4.25 ($4.65 adjusted) is greater than both.
MS LSPF of $53.40 (INVALID on today’s date) implies a Forecast Low P/E of 27.5: less than the above-stated 30.0. MS LSPF is 8.3% less than the default $1.94/share * 30.0 = $58.20 that results in more conservative zoning. MS LSPF exceeds mine by 31.2%, however.
MOS is robust in the study because my inputs are less than or near bottom of historical/analyst/MS averages/ranges. Also backing this assessment is MS TAR exceeding mine by 8.9% (too high, really) per year and my lower LSPF.
Regarding valuation, PEG is 0.98 and 3.5 per Zacks and my projected P/E, respectively: a bit overvalued (M* has 0.29, which seems unreasonably low). Relative Value [(current P/E) / 5-year-mean average P/E] is exceedingly low at 0.41 (even with all upside outliers removed). “Quick and Dirty” DCF calculates the stock undervalued by 34%, precisely matching M* assessment.
BSX makes for a challenging stock study because of the GAAP/adjusted EPS differences and because the historical P/E data is so scattered. I feel I’ve discounted my inputs substantially throughout, though. If adjusted numbers are used to forecast future EPS, then the current study is well into the BUY zone.
Per U/D, BSX is a virtual BUY right now. Given a forecast high price of $91, BetterInvesting® TAR criterion would be met at [91.0 / ((14.87 / 100 ) +1 ) ^ 5] = $45.50 (no dividend).
A 90-day free trial to BetterInvesting® may be secured here (also see link under “Pages” section at top right of this page).
Categories: BetterInvesting® | Comments (0) | PermalinkTrading Epic Fury (Part 15)
Posted by Mark on April 27, 2026 at 07:58 | Last modified: May 9, 2026 16:01Aside from using TA, another way to get positive delta (NPD) is simply to respect the stop-loss.
I use a stop-loss with most of my trading to exit positions that go against me. If I sell a put [spread] for $3.00, for example, then a 3x stop loss means I would close if it increases to $9.00 or more. (6) here illustrates a sample strategy.
Perhaps because I don’t sell calls very often, I generally do not use an upside stop-loss. When I “campaign,” I look to roll out and up for a credit as expiration approaches. I also watch the portfolio greeks (i.e. the “net position” aspect of NPD or NPV discussed in Part 14). In a typical market with positive drift, I’m okay holding DITM short calls as long as NPD is positive, which I have done most of the last few years.
Closing short calls increases NPD by effectively buying the call: a positive delta event. Respecting the stop-loss does this.
The consequences of campaigning (no stop-loss) can be shocking when studied in isolation. Recall (3) from Part 7. The 2 DTE 6400 calls were sold for $21.30. While most have since been closed, a couple have been campaigned and now sit at the 6500 strike priced ~$910: an unrealized loss over 25x including a few rolls to capture additional premium!
The potential savings realized by respecting the stop-loss and closing everything the very next day is staggering. I mentioned a “windfall” in the fourth paragraph of Part 14 by getting positive NPD near the right chart arrow of Part 12. Now I’m entertaining the idea of getting positive NPD at the left chart arrow with SPX even lower [by ~40 points].
Caution is warranted, however, as NPD would be much greater after closing all the stopped-out calls. That represents significant risk in case the unidirectional rebound (V-bottom) does not materialize—and right on the heels of a big losing day, too (albeit not as bad as two days prior).
There is no easy, guaranteed answer.
As I go through the analysis and tab certain concepts for inclusion on a daily trade management checklist, one challenge is to avoid conflicting guidelines. Remember the penultimate guideline here that might have had me closing 50-100% of the position after this day [“two days prior” from two paragraphs above]. The consideration about respecting stop-loss would be largely moot [and I would have been in the catbird seat just 2% off my equity ATH where getting positive NPD after the left or right arrow could have subsequently added further to profits].
Beware of 20/20 hindsight. I don’t want to think I could do anything heroic that would have seemed murky in the moment.
Categories: Option Trading | Comments (0) | PermalinkTrading Epic Fury (Part 14)
Posted by Mark on April 24, 2026 at 07:36 | Last modified: May 8, 2026 09:00Today I continue discussing the potential benefit of technical analysis (TA) as a trigger to get positive delta.
I want to make one clarification regarding equivalent terms: delta and net position delta (NPD). The former refers to one particular option whereas the latter refers to summation across the entire option inventory. I mean the latter in all cases despite using them interchangeably.
In Part 13, I explain where SPX crosses above the 20-SMA. Since I don’t actually know this until the close and because trading takes time, let’s be conservative and assume I wait an extra day for confirmation (Apr 7). The goal would be to maintain positive NPD thereafter by closing short calls as needed.
How much positive NPD to target is debatable but a good starting point would be equal theta:delta with opposite sign. This represents a windfall with the account on Apr 7 less than 4% off its high and every subsequent day then being profitable.
I would also be in position to capitalize on some volatility contraction [due to negative net position vega (NPV): see fifth paragraph here]. A massive upmove on Apr 8 drives VIX 4.8 points lower to ~21 but negative delta by the close would offset some negative-NPV gains. Most remaining short calls would probably be closed to re-establish positive NPD thereby allowing all remaining volatility contraction (e.g. on Apr 9 to 19.5 VIX drifting lower to 17.5 on Apr 17) to be realized profit.
With that as best-case scenario, second-best would probably be to target delta neutrality. The result would pit negative NPD by the close on some days against negative NPV and positive theta. I would still expect profitability over the next couple weeks.
The reality was negative NPD for two weeks beginning on Apr 1 as I gradually closed DITM short calls. SPX rallied 8.4% while my NLV sank 2.6%. Since crossing above the 20-SMA, SPX has rallied 1+ SD (close-to-close) six times with zero such down days. The train indeed left the station and, at least so far, has not looked back.
Market activity over the last several years suggests V-bottoms to be commonplace, but I always like to play devil’s advocate and consider other possibilities. When the market goes into correction, it has behooved us to look for signs of reversal in preparation for a strong rebound. TA can help with this but as stated in Part 12, TA is notoriously bad with prediction. The preceding five paragraphs could have been null and void were the Mar 30 low (left arrow from Part 12) taken out.
Stated another way, the table in Part 13 puts me in a mindset where these quick recoveries are doctrine but behold 2022! In the future, the only thing likely guaranteed is that change will eventually step to the fore.
I will continue next time with discussion of stop-losses.
Categories: Option Trading | Comments (1) | PermalinkTrading Epic Fury (Part 13)
Posted by Mark on April 21, 2026 at 06:45 | Last modified: May 7, 2026 14:36Now on the other side of Epic Fury recovery, I discuss the bullish case in Part 12 with regard to news and technical analysis. The latter is a potential trigger to get positive delta.
It’s hard to be sure, but over the last few years it feels like I have lost money with short calls. I often close a call and sell a put(s) to cover the cost. This masks the loss and unless I sell more puts and take on more downside exposure, my overall return will lag. The maneuver effectively extends time required to realize the initial profit thereby diluting annualized return.
The latter is juxtaposed with the benefit of otherwise wasting upside margin. Maintaining permanent downside exposure gives me the opportunity to take on some upside [exposure] with no additional [portfolio] margin requirement. Perhaps I might as well even if it’s limited [which unfortunately was not the case on too many candles beyond the Part 12 chart’s left arrow].
Whether or not I have actually lost money selling calls, looking at the bear markets and market corrections since 2008 makes it clear that recoveries have generally been quick (courtesy Google AI):
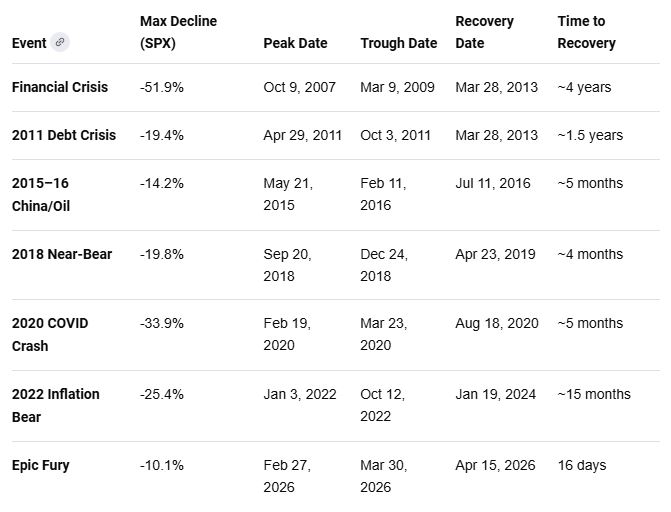
COVID is the fastest recovery from a 30%+ decline in history. Epic Fury is shallower and takes only a couple weeks to recover. Previous declines in 2018 and 2015-16 are also swift once the bottom is reached. Moral of the story: when the train leaves the station, I better be aboard.
What I am about to discuss would have worked for Epic Fury. Based on these quick recovery times, I suspect it would have also worked for other declines. It will be instructive to revisit these periods, though, to assess the worrisome whipsaw potential. I worry about removing upside exposure in favor of [more] downside only to immediately see the previous low taken out. That can devastate NLV and result in catastrophic loss.
Technicals can help determine when the train starts rolling. My gut feel (probably worth very little) tells me that while [price closes above the] 50- and 200-SMA are good recovery indicators, my trading may require a shorter period. This certainly applies to Epic Fury where I employed shorter and shorter-dated options including many at 0-1 DTE. The 20-SMA, reclaimed two candles before that [Part 12] left arrow, seems better suited and a significant event in and of itself being the first time since Epic Fury the market actually closes above [the 20-SMA or middle Bollinger Band].
I will continue next time.
Categories: Option Trading | Comments (1) | PermalinkTrading Epic Fury (Part 12)
Posted by Mark on April 16, 2026 at 07:46 | Last modified: May 9, 2026 15:00With Marco Rubio now proclaiming Epic Fury over, I want to wrap up my qualitative trading analysis because things did not end up well for me.
Things were going well as of Mar 30 (see Part 6). Since then, we have gotten:
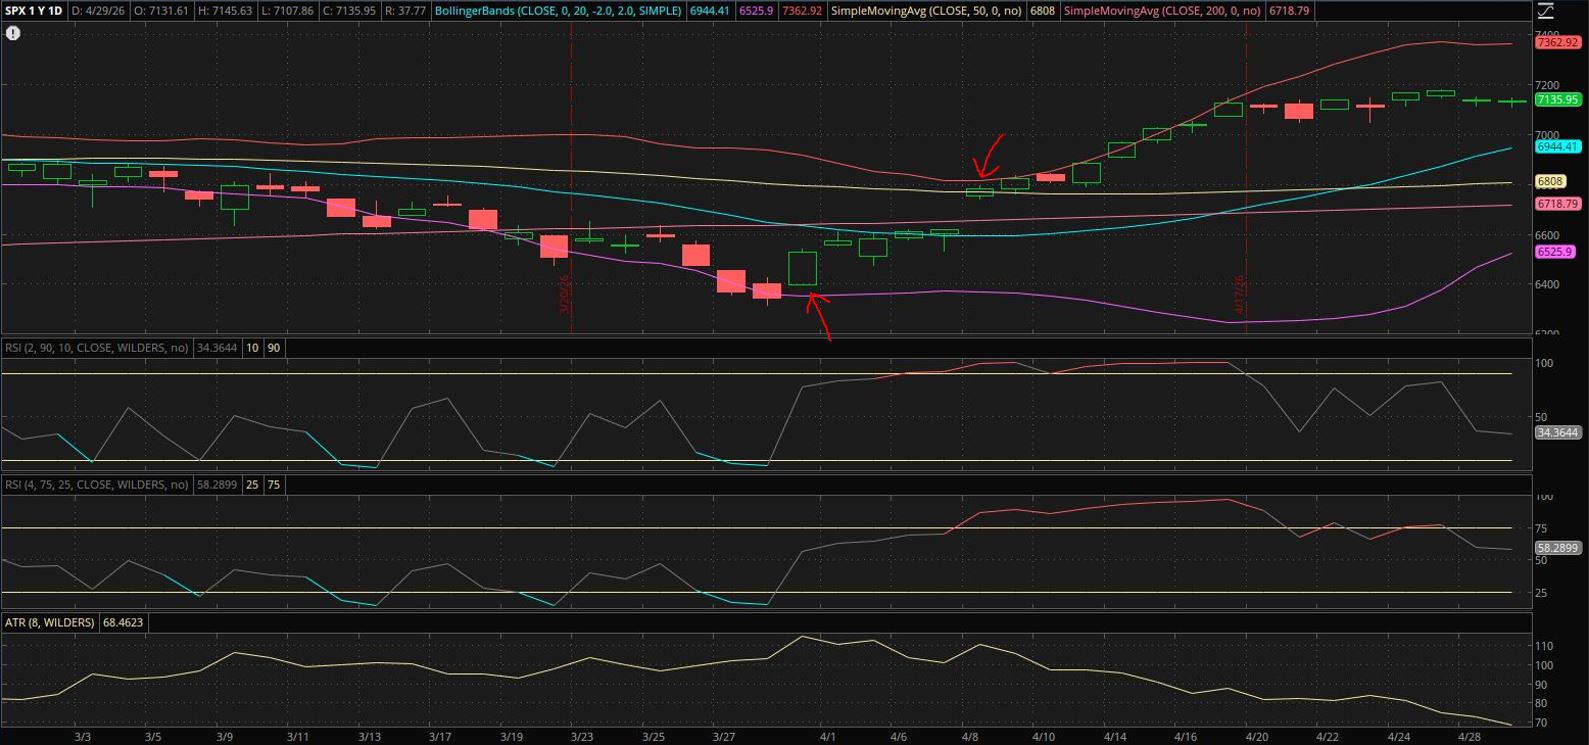
The left arrow is Mar 31: first trading day after my Part 6 post. The right arrow is Apr 8. From a technical standpoint, the 20-SMA is reclaimed two candles earlier. Apr 8 reclaims the 50- and 200-SMA and the upper Bollinger Band is breached one day later on Apr 9. In retrospect, it’s clear by this point the rally is on.
In the moment with all the news swirling about, we don’t know the coast is on its way to being clear at the left arrow. Uncertainty reigns especially with many believing nothing the President says can be trusted because of how often he flips, contradicts himself, etc. Isn’t such the case with any politician, though?
For the sake of trading alone, the best advice is probably to ignore news altogether. I failed here by making a point to watch the nightly news regularly then switching to “Iran updates” online to get more “timely” reports. News varies by source and even by content and origination date as time progresses. History changes and evolves.
In contrast, technicals and day-of-the-week references are persistent and historically reliable. Technical analysis may be notoriously bad when it comes to prediction but with regard to retrospective trading post-mortem, it is a good yardstick to use. I give seasonal and technical rationale for the bull case in Part 9 and Part 10 (actually written on Apr 6).
Short calls were good to me until they weren’t during Epic Fury but over the last few years, it feels like I have lost money with them. Would respecting the stop-loss outperform a long-term campaign? Admittedly, campaigns aren’t terrible because eventually the market will fall enough to present loss-mitigation opportunity [probably coinciding with a desire to open more short calls for downside protection, unfortunately]. If the market makes an abrupt V-shaped recovery like it did here, though, then I’m caught with my pants down [probably being spanked pretty hard].
At the very least, short calls are somewhat tempting. During the campaign, I’ve made some money rolling the short calls for many months. Since I have no other upside margin, maybe it can’t hurt to continue.
Positive delta during the recovery would have been the panacea. It’s tough because leaning positive delta bleeds capital in a declining market, but at some point—either through a technical or stop-loss filter—those short calls might best be closed.
I will continue next time.
Categories: Accountability | Comments (1) | PermalinkUnderstanding ROE (Part 8)
Posted by Mark on April 13, 2026 at 07:51 | Last modified: April 28, 2026 12:45Today concludes the mini-series on return on equity (ROE) that has also discussed ROA, ROIC, and some case studies.
Probably the most important thing I have learned from writing this is how to deal with unconventional cases like BKNG, SBUX, and DPZ. For starters, look at shareholder equity (total assets – total liabilities)—also known as book value. If negative, then expect quirky ROE numbers like negative numbers or “too-good-to-be-true” triple digits because ROE becomes a [broken] ghost metric. As I have discussed, these are cases where ROA and/or ROIC might be better to study.
With such heavy mention of “shareholder equity” throughout this mini-series, I think it’s worthwhile to spend some time discussing that more common synonym often mentioned in financial writings.
For many different reasons, “book value” is often in quotation marks:
- To distinguish it as a specific accounting term rather than a definitive measure of a company’s true current worth.
- As accounting convention based on historical records that may not align with current market prices [capitalization].
- Because balance sheet reflects costs minus depreciation, which may be much lower than current fair market value.
- To indicate the term is being used in its technical sense as shareholder equity rather than a general estimation of value.
- To signal skepticism or irony regarding the accuracy of the figure (i.e. “scare quotes”).
- To suggest the [cooked] “book value” is inflated or inaccurate if a company’s financial statements are under scrutiny.
Shareholder equity is actual accounting book value, but the quotation marks are a warning label that the official number may hide the economic reality. It’s often just a starting point that may need heavy adjusting because it fails to reflect what a company is truly worth due to standard accounting rules. For example, massive value drivers like brand reputation, proprietary software, and trained workforces are almost always ignored in accounting book value. In practice, book value is often viewed as the bare minimum value [rather than its value as a growing business] if the company were to be shut down immediately.
As a result, analysts often move from the “actual” accounting number to an adjusted book value by revaluing [marking to market] tangible assets (e.g. land) to their current sale price, by cleaning up liabilities by adding off-balance sheet items or potential legal costs that haven’t yet been recognized, and by calculating book value/share subtracting preferred stock to reflect what common shareholders would receive.
Categories: Financial Literacy | Comments (0) | PermalinkUnderstanding ROE (Part 7)
Posted by Mark on April 10, 2026 at 07:16 | Last modified: April 24, 2026 08:42In Part 6, I discussed the misleading return on equity (ROE) for SBUX. Today I want to look at Domino’s Pizza (DPZ).
According to Google AI, ROE for DPZ is as follows according to six different sources:
- 15.4% TTM as of Apr 2026 per FinanceCharts.
- -15.4% TTM based on -$3.9B shareholder equity per Wisesheets.
- 6.2% per Danelfin.
- Distorted by low equity with return on assets (ROA) at 35.1% per ChartMill.
- -10.7% in ’26 per MarketScreener.
- Distorted by negative [shareholder] equity and therefore N/A per PEvaluation.
While negative ROE usually means a company is losing money, DPZ has negative shareholder equity rather than negative profit. The company has aggressively used debt to fund massive share buybacks and dividends. The “asset-light” model results in liabilities exceeding assets with a shareholder equity of -$3.9B. Net income (’25) is +$602M, though. Simply Wall Street notes that DPZ maintains a healthy interest coverage ratio of 4.9x to 5.3x suggesting it easily pays the interest on its debt.
Because DPZ ROE is distorted by negative shareholder equity like SBUX, we may look to ROA or return on invested capital (ROIC). ROA > 35% outperforms nearly all industry peers.
ROA seems “too good to be true” (see Part 4) and may also be distorted. ROA is high primarily because of an asset-light franchise model, not just raw profitability. Franchising means the massive real estate and equipment costs of 20,000+ locations are not on the balance sheet (total assets only $1.7B). Despite owning few stores, DPZ collects high-margin royalties and supply chain fees creating a relatively large net income divided by a very small asset base.
Articles at Business Model Mastery and Restaurant Business compare DPZ with McDonald’s (MCD): two companies with heavy debt but different asset structures leading to vastly different ROA. MCD ROA is 14.4% due to ownership of massive real estate. Owning land and buildings for most locations results in a $60B total assets leading some to describe MCD as a REIT disguised as a burger chain. Both have negative ROE (-478% for MCD) due to debt and share buybacks.
Where negative shareholder equity breaks ROE and an ultra-low asset base inflates ROA, DPZ ROIC remains stable. ROA uses net income in its numerator: after interest expenses are paid. DPZ has massive debt and huge interest payments that make the business look less efficient. ROIC ignores interest by using net operating profit after tax. This isolates the pizza business performance from the “noise” of how it is funded. ROA also falls prey to the “lazy cash” problem because total assets include things that don’t actually help make pizza (e.g. excess cash in a bank account, old unused equipment) that inflate the denominator and lower the score. ROIC ignores non-operating items thereby giving a tighter view of management’s skill.
Where ROA is better for asset-heavy firms like banks and factories, ROIC ~50-60% shows DPZ earning far more than its weighted average cost of capital (~9%) and therefore a significant value generator despite an unusual balance sheet.
Categories: Financial Literacy | Comments (0) | PermalinkUnderstanding ROE (Part 6)
Posted by Mark on April 7, 2026 at 07:46 | Last modified: April 23, 2026 09:03In Part 5, I discussed the misleading return on equity (ROE) for BKNG. Today I want to look at Starbucks (SBUX).
Recall with BKNG that ROE can be confusing because:
- Standard financial formulas crash when shareholder equity [the denominator; see (1) in Part 1] is negative. Some platforms will show “N/A,” while others might show a massive positive or negative percentage based on automated math calculation failing to account for the negative equity context.
- Negative equity suggests a company is near bankruptcy. BKNG, however, is highly profitable with ~$8B in annual free cash flow. The negative equity is a management decision rather than a sign of failure.
- BKNG has spent over $52B on share buybacks. Buybacks reduce shareholder equity artificially inflating (or breaking) ROE calculation making it impossible to use for comparison with companies employing different capital structures.
Google AI reports SBUX 2026 ROE of -17%. ROE is +16% for ’25—a sharp decline from the 12-month average of +32%. Before shifting to negative shareholder equity (’19), its high positive ROE peaks > 386% in ’18 due to high leverage.
To illuminate and clarify, FinanceCharts.com (cited by Google AI) literally says:
> The return on equity (roe) for Starbucks (SBUX) stock is 16.32% as of
> Wednesday, April 22 2026. It’s worsened by -49.51% from its 12-month
> average of 32.33%. The 5 year average return on equity (roe) is 43.04%.
Worsening by a negative value is the same as improving by the positive. 16.32% worsening by negative 49.51% means it has increased from a 12-month average of 16.32% – 49.51% = -33.19%: inconsistent with the above-stated +32.33%. I consider this a prime example of how broken some of these math algorithms can be when shareholder equity is negative.
Like BKNG, persistent negative equity is a result of deliberate capital allocation strategies. First, SBUX historically returns significant capital to shareholders via share buybacks often funded using debt. Second, SBUX maintains a streak of over 60 consecutive quarters of dividend payouts that further reduce shareholder equity. Finally, long-term debt has climbed to over $15B as the company invests in store expansions and its “Back to Starbucks” turnaround strategy.
Given the distortion in ROE, a stock analyst is advised to use other efficiency metrics. ROA (see Parts 3 and 4) is currently +4.3%. This measures profit against the total asset base rather than just shareholder equity. Return on Invested Capital (ROIC; see Part 2) is currently +6.8%. This is another more reliable metric for SBUX that accounts for both debt and equity.
For more details on financial health, Google AI suggests tracking SBUX ROE trends on Macrotrends or viewing quarterly growth performance on FinanceCharts.com. You can also read the latest valuation reports on Yahoo Finance or explore long-term return trends on Stock Analysis on Net (https://www.stock-analysis-on.net/).
I hope to conclude next time with one more case study.
Categories: Financial Literacy | Comments (2) | PermalinkUnderstanding ROE (Part 5)
Posted by Mark on April 2, 2026 at 06:53 | Last modified: April 23, 2026 07:41I want to finish the mini-series by presenting some cases where return on equity (ROE) seems nonsensical and may be misinterpreted.
The first case is Booking Holdings (BKNG). Per Google AI, TTM ROE is 97% as of Apr 2026.
In my opinion, 97% ROE falls under the “too good to be true” category, but this is not unusual for BKNG. Pre-Pandemic (2019), ROE is a more “normal” but still strong 82%. In ’22, ROE is 110%, a sharp increase from previous years driven by recovery in travel demand and increased financial leverage. ROE fluctuates wildly from ’23–’25, often appearing highly positive (e.g. 156% in ’23).
ROE is a complex and potentially misleading metric for BKNG because it operates with negative shareholder equity. The impressive percentage turned up by some traditional screens is a mathematical quirk of having a negative denominator [recall (1) here]. BKNG reports shareholder equity of -$5.6B in ’25 largely driven by aggressive share buybacks and debt-financed capital allocation. The negative shareholder equity is not due to operational losses, though. In fact, BKNG remains highly profitable with $5.4B TTM net income.
Despite negative shareholder equity, some sites will report positive ROE due to a programming shortfall. It should be reported as a negative figure or “N/A.” Instead, sites like FinanceCharts.com use absolute values or specific internal logic to show a performance percentage when there really isn’t one. The positive percentage is a ghost metric.
Platforms such as Wisesheets.io report the same data as negative ROE or “N/A” following standard application of the formula with shareholder equity of -$5.6B (i.e. a shareholder deficit) at the end of 2025 divided into positive net income.
The reality is a highly profitable BKNG [$5.4B net income for ’25, as mentioned above] that has wiped out its equity book value through massive share buybacks rather than business losses. Negative equity is a deliberate management decision rather than a sign of operational failure.
For stock analysis when shareholder equity is negative, it can help to:
- Use Return on Invested Capital (ROIC) to see how well the company uses all its capital (equity and debt). BKNG recently reported an ROIC of 43.7%, which remains a valid and strongly positive number.
- Focus on cash flow metrics like Free Cash Flow (FCF) and FCF Yield to study how the company generates cash regardless of its accounting book value. BKNG grew FCF 15.1% in 2025.
- Evaluate solvency by interest coverage rather than Debt-to-Equity. 13.6 interest coverage indicates well-managed debt.
I will continue next time.
Categories: Financial Literacy | Comments (2) | Permalink