Trading Epic Fury (Part 2)
Posted by Mark on October 3, 2025 at 07:48 | Last modified: March 18, 2026 17:10Today I continue from the third paragraph of Part 1 to review the charts on what Epic Fury has done to the markets.
I spoke with a friend yesterday whose portfolio is down substantially year-to-date. She spoke about how the markets have been so unpredictable since the war began. “Today is the first time in a month that we have had back-to-back up days,” she said. “The market will often be down 1,000 points, etc… my calls are way under water.”
Looking at a daily chart of SPX (S&P 500 cash index) since last trading day of Jan (30th), most of what she said is not true:
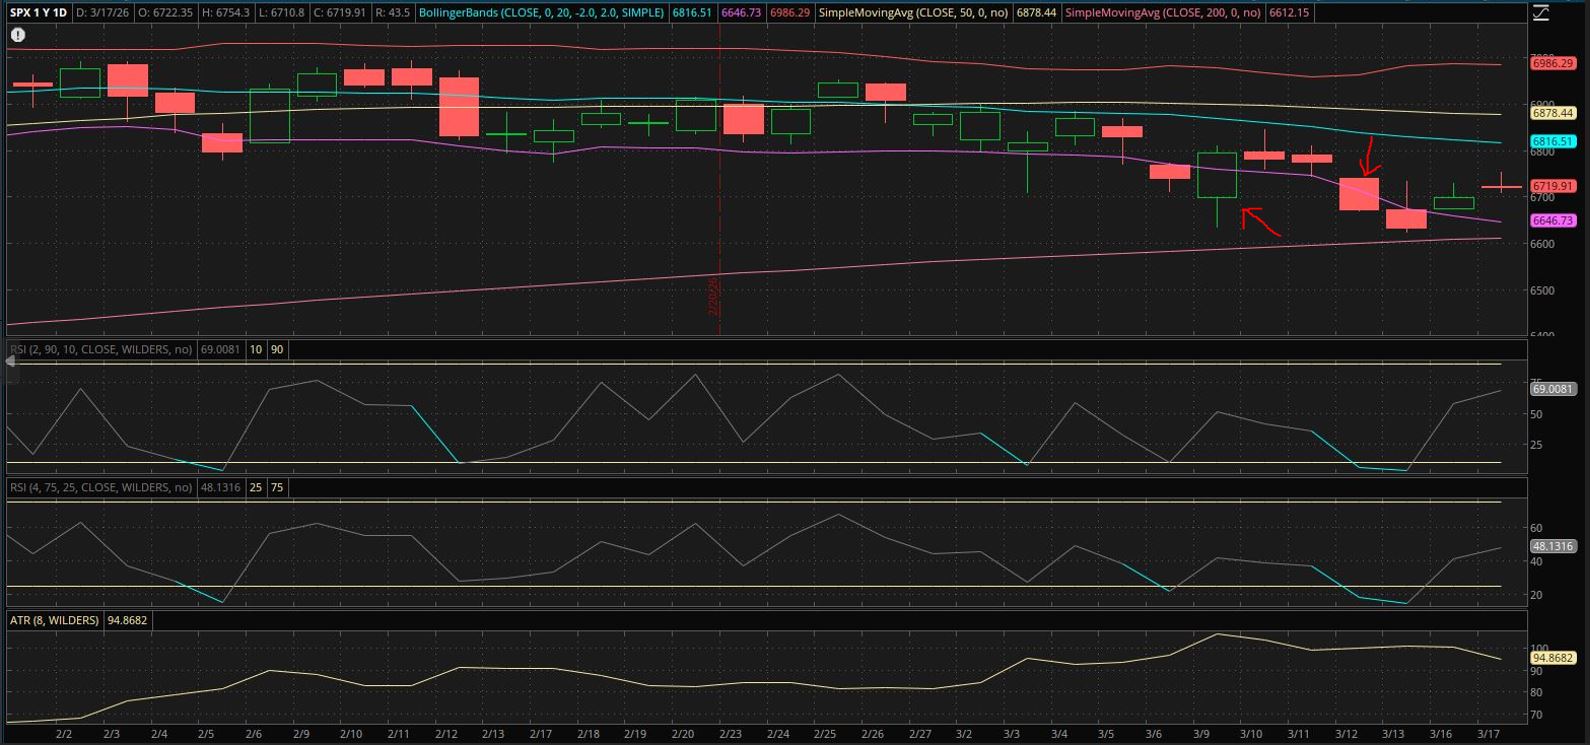
The index is down from roughly 6920 to 6720 in that time or (6720 – 6920) / 6920 * 100% = 2.9%. Bear market is a 20% decline while a “market correction” is often said to be a 10% decline. So far, 2.9% is very little.
For my friend’s Jan ’27 long calls, any decline is bad. With six weeks amounting to 13% of the remaining time to expiration (Jan 15), pain from time decay will be noticeable. Her feelings about the market may be colored by the unrealized loss.
Here’s a daily chart of volatility (VIX) since Epic Fury begins:
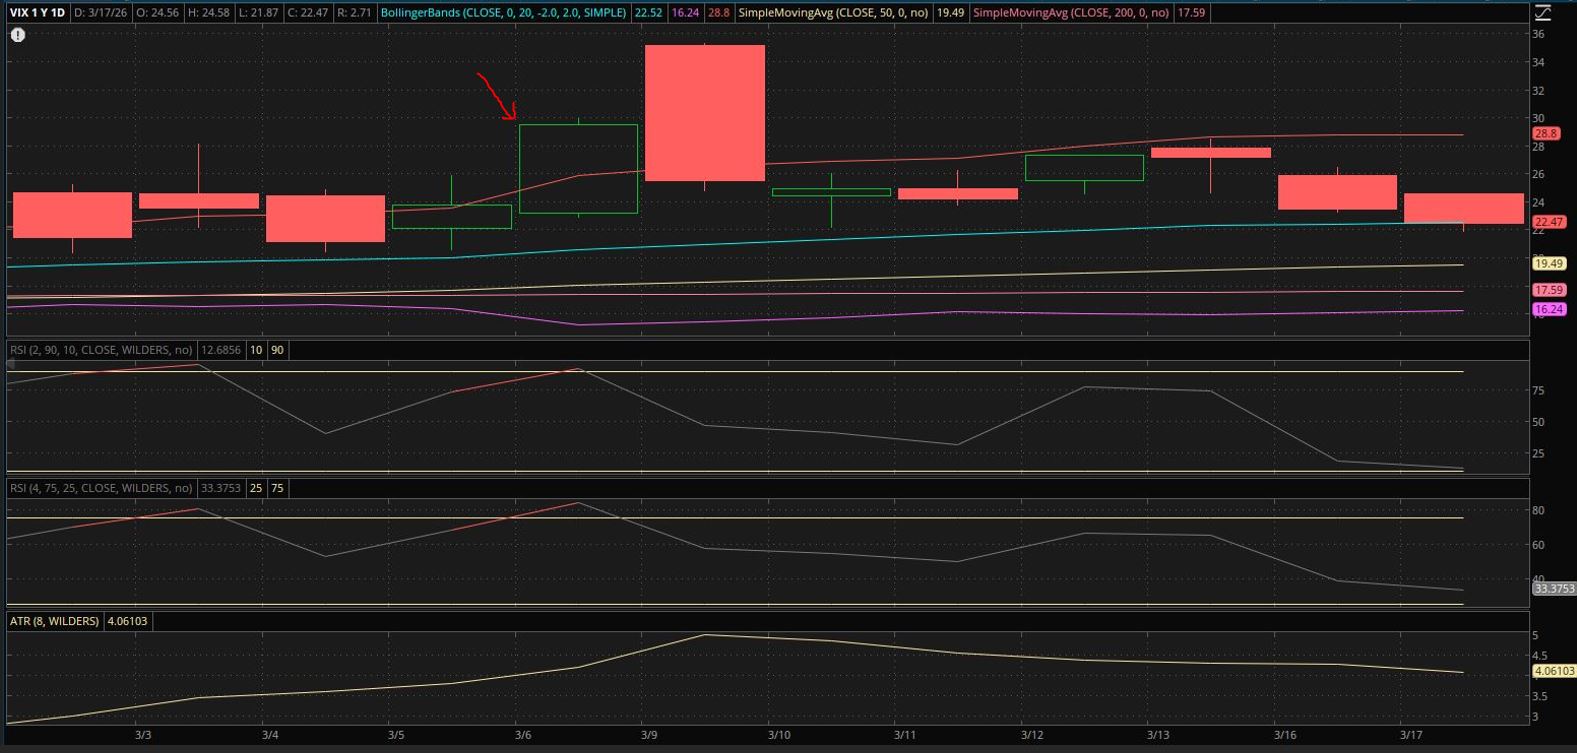
Leftmost bar is Mar 2. VIX increases a small amount from ~21.8 to 22.5 over the period. Mar 6 (arrow) is the biggest advance with a VIX close near 30 (SPX ~6740). The following day, VIX opens near 35 but closes near 25. This [and second arrow in top chart] is a very wide-ranging day [(~6640 to 6800 close on SPX—first arrow in top chart—on a day when ATR(14) actually tops out year-to-date], but trading just near the close (one of my implicit guidelines) has prevented potential whipsaws from the large intraday ranges.
To see if I have violated this second bullet point, I need to zoom out for a longer look at VIX. The following is daily YTD:
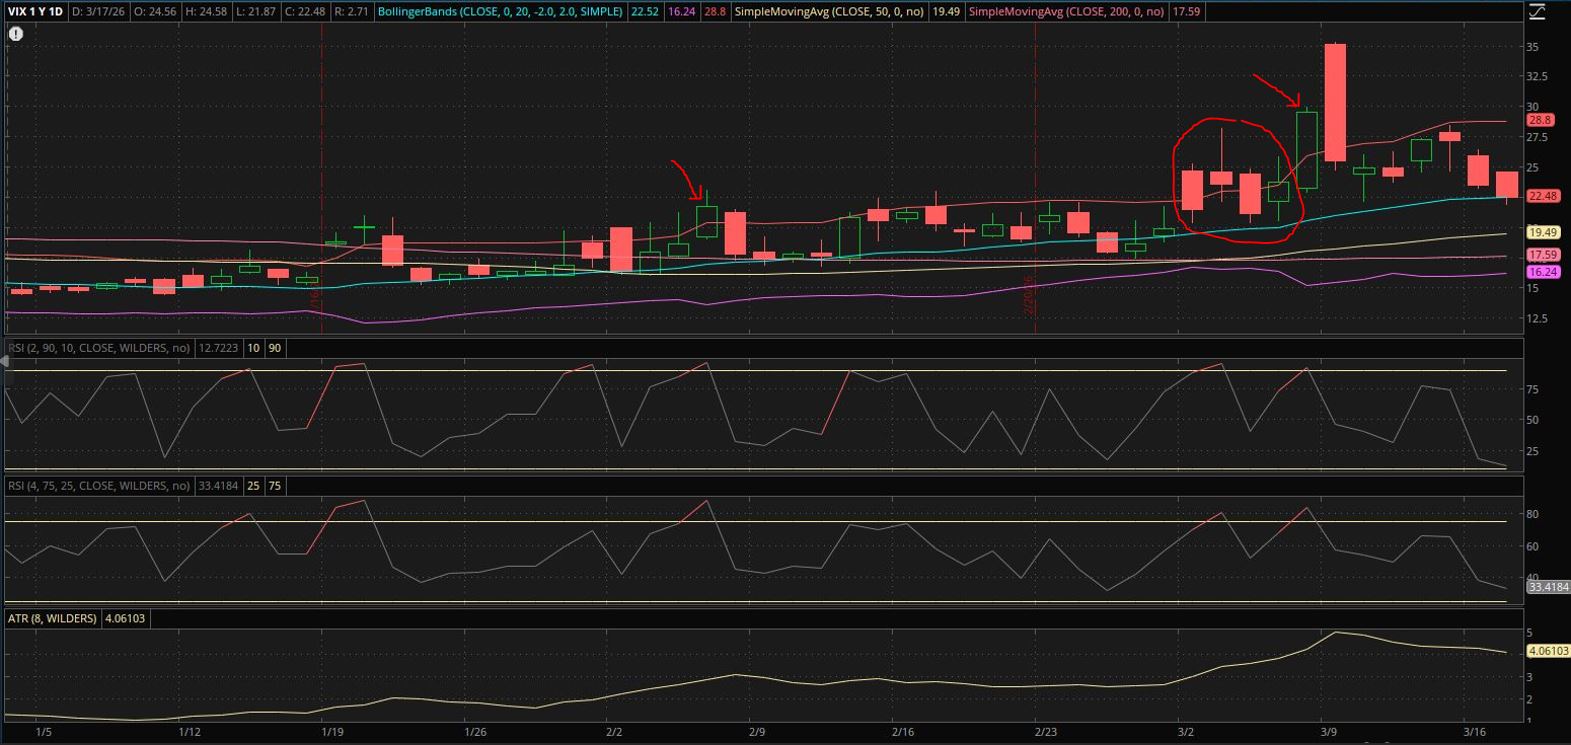
A gradual increase before Epic Fury is evident by the rising 20-SMA (blue line) since Jan 19. The first arrow on Feb 5 is the highest VIX close before Epic Fury. None of the first four trading days after the operation begins (circled) are large, strong, multi-week (or month) highs exceeding Feb 5. The first three candles are down days [first big, second huge upside wick suggesting volatility rejection, third like the first with close far below the open], and the fourth closes lower than the previous three opens. Mar 6 (second arrow) would be the day to “do something” except there’s really nothing to do.
Next time, I will explain why that is.
Categories: Accountability | Comments (0) | Permalink