Quality and Fundamentals (Part 7)
Posted by Mark on July 17, 2025 at 07:30 | Last modified: February 12, 2026 11:15Hello end of the tunnel! Today I conclude my series on Quality vs. fundamentals and what matters most for the SSG.
Two big conclusions stated last time answer the questions I set out to explore. First, the difference between high-quality stocks and good fundamentals may only be magnitude of [sales / EPS] growth and/or management metrics (i.e. PTPM, ROE, and Debt-to-Capital). Second, stocks with good earnings predictability—historically up, straight, and parallel—are necessary for the SSG methodology.
The reason I couldn’t end with Part 6 was Neff’s inclusion of “solid forecasted earnings growth.” This may not meet the BetterInvesting® criteria for high-quality growth stocks (not to mention high-flying P/E’s), but it’s certainly not “very little growth” as mentioned in the penultimate paragraph.
My prompt for Google AI was “can value investing involve low-quality stocks?” As it turns out, this concept dates all the way back to Benjamin Graham.
While contemporary value investing often prioritizes [high-] quality growth at a reasonable price, original Graham principles include strategies for buying “low-quality” or distressed assets if the price is sufficiently low to provide a significant margin of safety [MOS in my stock studies]. This is known by some as “deep value [cigar butt] investing.”
The relationship between quality and value typically falls into two distinct categories. Deep value involves buying stock in companies that may be low-quality or even in “retrogression” if they trade below net current asset [liquidation] value. Here, investors disregard traditional quality metrics in favor of extreme price discounts. The other category includes turnaround situations. In this case, investors look to buy stock in companies of low quality due to temporary setbacks, poor management, or industry cycles with hopes of return to higher quality status.
The risk of value trap applies to both categories where a stock appearing cheap based on metrics like P/E or P/B is actually fairly priced due to its deteriorating business.
The following performance graph provided does not include statistical [inferential] analysis for significance or more than 11 recent years but it’s a start:
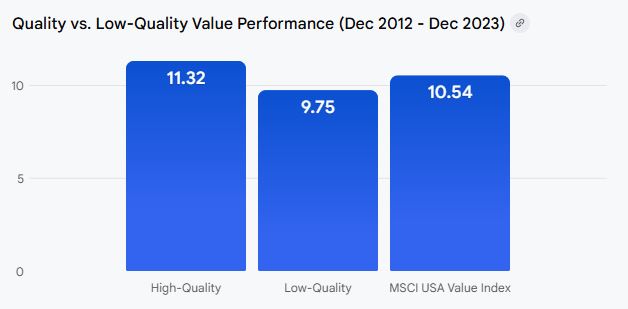
Although value investing with lower-quality stocks can provide return, the return may be lower and underperform benchmarks.
Different value investing philosophies treat “quality” differently:
- Traditional / modern value (Buffett / Munger) emphasizes high-quality companies with economic moats [competitive advantage] and eschews low-quality companies altogether.
- Graham’s defensive criteria recommend a minimum quality level such as S&P Earnings / Dividend Rating > B and at least 10 years of positive earnings.
- Deep value / contrarian specifically targets out-of-favor or distressed companies labeled by some as “junk.”
To help avoid value traps (permanently impaired low-quality stocks), heed these warning signs:
- Inconsistent profits in the form of frequent losses or “one-time” charges that recur.
- Companies with more debt than equity (or high Debt-to-Capital) are often considered lower quality and higher risk.
- “Cheap” prices in a dying / declining industry (e.g., legacy retail).
- Low share prices (especially < $5.00) can lead to reduced liquidity and higher volatility making recovery more difficult.
Onward and upward my fellow investors!
————————
A 90-day free trial to BetterInvesting® may be secured here (also see link under “Pages” section at top right of this page).