Crude Oil Strategy Mining Study (Part 6)
Posted by Mark on September 10, 2020 at 07:11 | Last modified: September 19, 2020 14:41Today I will wrap up with criticism and conclusions from my latest study on crude oil.
Hypothesis[3] is flawed because it contains a future leak. Only in retrospect will I know how the market moves, but the hypothesis must be defined beforehand. Indeed, whether the hypothesis bears out depends on whether the market goes up/down. I clearly have it backwards.
I think the key to avoiding hindsight bias and future leaks is to put myself in the moment of uncertainty and to figure out how I will make the decision. I can easily look back and say “we were in a bull/bear market,” but in the moment all I have are operational definitions that may or may not be effective. Backtesting will determine this.
This is all to say that while the second sentence in paragraph three of Part 4 is easy to say, in the moment I may or may not be able to deliver. In my testing thus far, I have found all lookback periods to face significant challenges.
Perhaps the harshest criticism of this study is that I may have done the statistical analysis incorrectly. I got a #NUM! error in Excel and e-mailed the plug-in developer. His answer—something he admittedly may have failed to mention—made me question the entire battery of tests. The documentation looks tantamount to an entire statistics course. I will review this before analyzing further to make sure I don’t miss anything else. If necessary, I will revisit this post to correct any mistakes.
I didn’t apply the Holm method and I used alpha = 0.05. Hopefully after studying the documentation, I will have a better answer as to whether the former is necessary and/or whether the latter is too high for multiple comparisons.
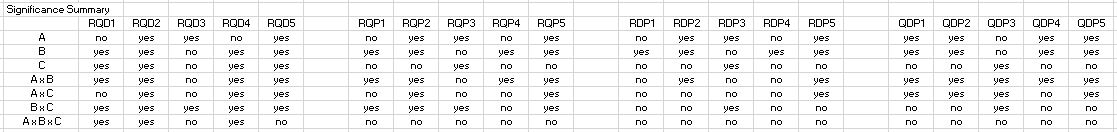
Turning my final focus to overall conclusions, while many of the differences I presented are statistically significant, they are close to being wrapped around zero. Most performance numbers average out to be slight losers.
Here are [cumulative] frequency histograms for all 1,632 strategies (i.e. Upper Limit of 1.0 means 0 < PNLDD < 1) :
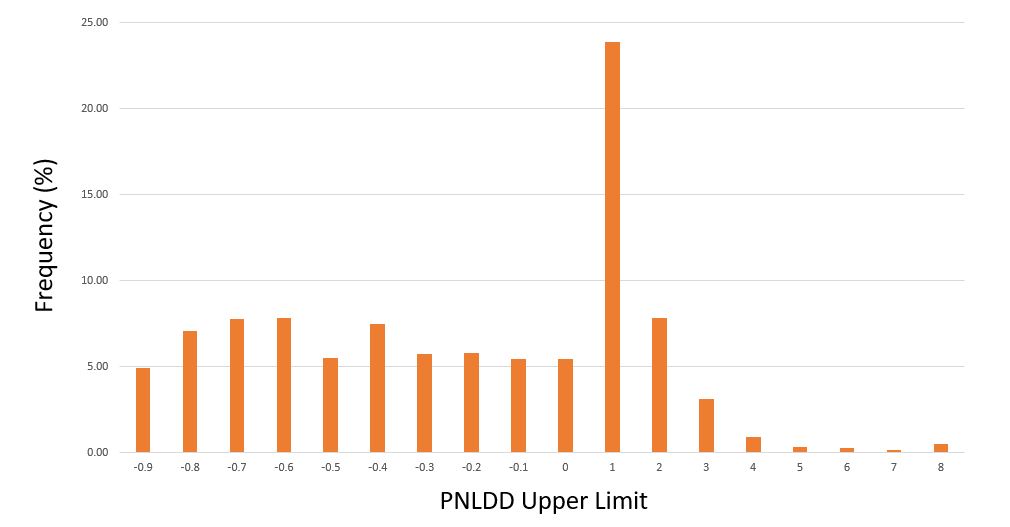
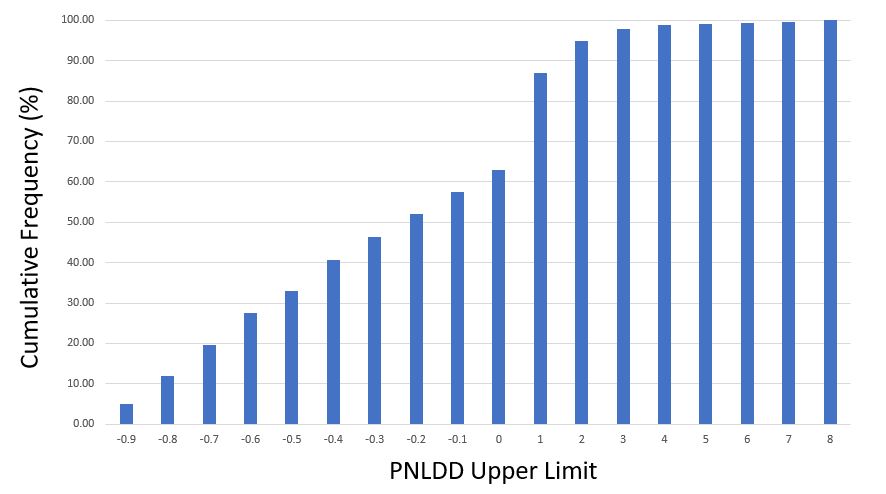
Strategies clock in with dynamite PNLDD numbers (over 2-3)—but it’s only 5% of the total while other strategies are complete meltdowns (see third-to-last paragraph here). I would discard the horrible ones, but this begs the question how the best strategies generally perform going forward. For the next study, perhaps I will shorten up the time intervals and test an OOS3.
This is only my second mining study, but so far I don’t see a whole lot to be excited about. For me, that does not bode well for algorithmic trading.
Categories: System Development | Comments (0) | Permalink2020 Career Counseling Update (Part 2)
Posted by Mark on September 8, 2020 at 07:06 | Last modified: September 19, 2020 14:40Picking up where I left off, here are my current thoughts about becoming an investment advisor representative (IAR).
I don’t feel like I can really talk to friends or family about investing because I am not registered to give financial advice. Strictly, a three-prong test exists for what constitutes an IA:
- The person gives advice on securities.
- The advice is given as part of a regular business.
- The person receives compensation for the advice.
In talking to others, I would be regarded as doing the first. I may be regarded as doing the second if I give advice along with trading, which is now my regular business. While I would never accept compensation without being registered, two out of three is too close for comfort. I therefore choose to say nothing at all.
And since I haven’t written this in a while:
> Nothing in this blog constitutes investment advice or any recommendation
> that any [portfolio of] security[s], investment product, transaction, or
> investment strategy is suitable for any specific person. As a blogger, I
> cannot assess anything about your personal circumstances, your finances, or
> your goals and objectives, all of which are unique to you. Any opinions or
> information contained in this blog remain just that: opinions or information.
> You should not use my blog to make financial decisions. You should seek
> investment advice from someone authorized to provide it.
Returning to the topic at hand, while part of me resents not being able to communicate with friends/family about the topics I love, another part is at peace. Quite honestly, I still have reasonable doubt as to whether anything I have studied is significantly better than long-term passive investing despite trading full-time for a living over the last 12+ years.
While I maintain hope that some strategies I implement do offer alpha, I am not qualified to evaluate the suitability standard (see here) in recommending them. As an IAR, I would be well-versed in suitability from training to everyday application.
I still have great interest in backtesting and developing trading systems. I would like to learn more about programming and statistics to acquire powerful tools to answer my research questions. I may or may not be able to continue this work as a full-time IAR working 40+ hours/week. I certainly don’t see this work fitting in with my target clients—most of whom will probably be laypeople when it comes to financial literacy.
I miss working with others. Other traders with whom I can communicate have been like a proverbial “flash in the pan” on a variety of different wavelengths. Many of them have been quick to believe what they get from books or the internet as opposed to doing the hardcore testing to confirm or deny hollow claims (so many of which are not true or actionable). For these reasons and others, I have been unsuccessful in cementing long-term collaborative relationships.
As an IAR, I would be able to collaborate with colleagues on the advising; could I also find other professionals committed to quantitative work? Or is the only place I could really hope to find such like-minded folk among the hedge fund and other performance-chasing firms that look to hire MSFEs and PhDs? One thing I don’t want to pursue at this juncture is a whole other degree field* unless I can merge it with IAR training (and tuition reimbursement?) to ultimately benefit my firm.
As a final thought, I definitely want to continue trading options even if I go the IAR route. I’ve never been a day trader and I do not require being glued to a screen to watch every tick. I would want to check the market 1-2 times per day and place trades/adjustments accordingly, though. This would have to be approved by my firm’s compliance department.
* — For what it’s worth, I did pass the Series 65 exam [for the second time] in fall 2019.
Crude Oil Strategy Mining Study (Part 5)
Posted by Mark on September 3, 2020 at 07:32 | Last modified: July 20, 2020 16:37Today I want to continue discussing results from my latest crude oil study.
Monte Carlo drawdown (MC DD) relative to actual DD (fifth-to-last paragraph here) does not seem to be useful. 813 out of 1633 strategies had a MC DD less than the actual DD. These strategies performed significantly worse over incubation than strategies with actual DD less than MC DD (PNLDD -0.11 vs. 0.24, Avg Trade -$59 vs -$15, and PF 0.93 vs. 1.02). While this is somewhat of a surprise, over 81% of these were from the worst group. Best strategies significantly outperformed worst.
Randomized OOS had a significant effect on performance in favor of strategies that pass. In this study, 280 strategies passed Randomized OOS while 1382 failed. Passing strategies averaged 0.13 PNLDD, -$22 Avg Trade, and 0.99 PF versus 0.06, -$40, and 0.97 for failing strategies, respectively.
With regard to worst strategies, none passed Randomized OOS and a vast majority met the MC DD criterion. Best strategies included only a few that passed Randomized OOS and a few that met the MC DD criterion.
Like any study, this study is not without its limitations and/or criticism.
I should have required one Randomized OOS to pass rather than two. On a few occasions, I saw strategies pass and then not pass (or vice versa) upon retest. This made me think the test lacked sensitivity. Because I did not study this over a large sample size, I don’t know how often it actually takes place. In case this makes anybody uncomfortable, one software suggestion would be to make number of Randomized OOS simulations a customizable setting. I would prefer 2,000 simulations to running the test twice in hopes of saving time, but 2,000 curves on the spaghetti graph might be too messy.
I should have programmed the spreadsheet to compute Avg Trade since I recorded Net PNL and number of trades. Automating this would save time and decrease the probability of transcription errors.
I will continue next time.
Categories: System Development | Comments (0) | Permalink2020 Career Counseling Update (Part 1)
Posted by Mark on August 31, 2020 at 07:27 | Last modified: September 19, 2020 14:35I have experienced increased frustration lately finding others with whom to collaborate on trading-related projects. The time is ripe to update my career path.
I’m about one year into my algorithmic trading journey, which includes months taken in 2019 to begin learning three different programming languages (Python, VBA, and TradeStation EasyLanguage). The road has not been smooth. I have been through two different software platforms. I have paid a pretty penny for education. I have undertaken a handful of statistical studies that leave me with questions about what part of the financial roulette wheel I am likely to land by becoming an algo trader: red or black, anyone?
I have more research questions to pursue, but it gets somewhat stale not having others with whom to collaborate or to critique. I would ideally like to work with a group like this. Reasons for a team approach are discussed in the sixth paragraph here as well as here.
I find negative results to be eye-opening and insightful due to the sheer volume of promising blog posts, articles, and products available purporting to teach profitable trading/investment techniques and approaches (e.g. this post, second paragraph here, and here). The positive claims and compelling marketing contradict the harsh reality of negative findings.
Given the recent political climate, a brainwashing hypothesis may appeal to some.
I do not subscribe to conspiracy theories, however (see second paragraph here). I also do not find the negative approach (e.g. avoid X and Y strategies because they won’t work and can lead to loss) to be marketable when diving deep into the details. I discussed this in the third- and fourth-to-last paragraphs here and in terms of the “worst sales pitch ever” (see two of three final paragraphs here).
My outlook on the asset management industry has been dynamic over the years. I had a negative outlook when I began trading full-time for a living in 2008. In the last few years, my outlook has turned positive. Some of my thoughts on this topic can be found here and in paragraphs 2-3 here.
After 12 years, I view the asset management industry with respect and humility. The investment landscape can be very rough.
I remain largely alone, on an island, managing assets for myself.
Ever heard the saying “if you can’t beat ’em, join ’em?”
I will continue next time.
Categories: About Me | Comments (0) | PermalinkCrude Oil Strategy Mining Study (Part 4)
Posted by Mark on August 28, 2020 at 07:49 | Last modified: July 16, 2020 07:44Last time, I presented results for the first factor: R(ules). Today I continue presenting results from my latest strategy mining study on crude oil.
The second factor, Q(uality), has a significant main effect on performance (see hypothesis[2]). Not only are best strategies an improvement over worst, the best strategies are [marginally] profitable. Top strategies (n = 816) average PNL +$87, PNLDD 0.34, Avg Trade $1.38, and PF 1.05. As mentioned in the third-to-last paragraph here, none of these numbers approach what might be regarded as viable for any OOS results. They sure would be damning if they landed on the side of loss, though.
D(irection), the third factor, has a significant effect on performance: Avg Trade -$17 (-$57) and PF 1.01 (0.94) for short (long) trades. This should not be surprising since CL fell from $84.60 to $54.89 during the incubation period creating a downside bias (hypothesis[3]). What should be surprising is that as with PNLDD and Avg Trade in Part 3 (second table), Avg Trade is negative for both long and short trades while PF < 1 only for the latter.
A glance at the variable distributions helps me to better understand this apparent sign inconsistency. Avg Trade has an approximately Normal distribution with sub-breakeven (negative) mean. PF has a skewed distribution with a right tail out to 2.37 and left tail down to 0.22. In other words, the right tail goes 1.37 units above breakeven (1.0) while the left tail only goes 0.78 units below breakeven (1.0). This should produce some upward pressure on average PF to exceed 1.0.
The fourth factor, P(eriod), does not have a significant effect on performance. I find it peculiar that the 2007-2011 training period generates significantly more trades than 2011-2015, but I’m not sure why and I don’t think it really matters.
A significant 2-way interaction effect is seen between R and Q. Performance improves slightly in looking from two to four rules across the worst strategies whereas performance declines much more when comparing two to four rules across the best strategies. This interaction is the first graph shown here.
A significant 2-way interaction effect is seen between Q and D. Performance improvement is much greater for top vs. bottom strategies on the long side whereas performance improvement is marginal for top vs. bottom strategies on the short side (like the second graph in the link provided just above).
A 3-way interaction effect is seen between R, Q, and D. This is significant for Net PNL, PNLDD, and Avg Trade and marginally significant (p = 0.057) for PF. I’m not going to try and explain this interaction nor am I going to undertake a 4-way ANOVA by hand to screen for a 4-way interaction that I probably wouldn’t understand either.
I will continue the discussion next time.
Categories: System Development | Comments (0) | PermalinkCrude Oil Strategy Mining Study (Part 3)
Posted by Mark on August 25, 2020 at 07:27 | Last modified: July 15, 2020 10:41Today I will start to analyze results of my latest study on crude oil.
I ended up running four 3-way ANOVA tests. Recall the factors I am testing:
- R(ules: two or four)
- Q(uality: best or worst)
- D(irection: long or short)
- P(eriod OOS: 2007-2011 or 2011-2015)
I am running these analyses on five dependent variables:
- Net PNL
- PNL / max DD
- Avg Trade
- Profit Factor (PF)
- Number of trades
The first four are performance-related while the last is for curiosity.
Along the lines of “conventional wisdom,” here are some hypotheses:
- Four-rule strategies should outperform two.
- Best strategies should outperform worst.
- Long (short) strategies should outperform if the market climbs (falls) during the incubation period.
- Order of IS and OOS periods should not make a difference since strategies are selected on performance over both.
- Number of trades should be fewer for 4-rule than for 2-rule strategies (fifth-to-last paragraph here).
- The software is capable of building profitable strategies.
Here are the results:
Let’s begin with somewhat of an eye-opener: 2-rule strategies averaged PNLDD 0.15 and PF 0.99 vs. 4-rule strategies with PNLDD –0.02 and PF 0.95. I think this is surprising for two reasons. First, the simpler strategies did better (see hypothesis [1]). Second, the signs are misaligned for the 2-rule group. I checked for sign agreement on every strategy; how can overall PNLDD reflect profit when overall PF reflects loss? The answer is because strategy drawdowns along with the relative magnitude of gains/losses all differ. When averaged together, sign agreement may no longer follow.
Consider this example of two strategies with two trades each:
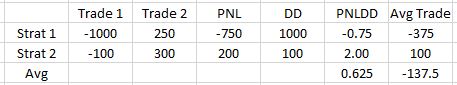
Signs align between PNLDD and Avg Trade for each strategy, but when averaged together the signs do not align. PNLDD may be a decent measure of risk-adjusted return, but it cannot be studied alone: sign must be compared with Avg Trade (or PNL). Forgetting this is like adding numerators of fractions with unequal denominators (i.e. wrong).
If I do nothing else today, then this discovery alone makes it an insightful one.
Getting back to the first factor, R does not significantly affect PNL or Avg Trade. PNL is almost identical over 816 strategies (-$4,014 vs. -$4,015). This is a good argument for risk-adjusted return (like PNLDD) as a more useful metric than straight PNL even given constant contracts (one, in this study). With regard to Avg Trade, 2-rule strategies outperform $33 vs. -$41. This difference is not significant.
Here’s something else to monitor: all results so far are negative (see hypothesis [6]).
I will continue next time.
Categories: System Development | Comments (0) | PermalinkMain Effects vs. Interaction Effects in Statistics
Posted by Mark on August 20, 2020 at 06:59 | Last modified: July 13, 2020 12:04I am almost ready to analyze the effects of different independent variables on strategy performance. Before I proceed, I think main versus interaction effects are important enough to illustrate.
One example is shown below:
![]()
Drug treatment appears to have no main effect on pain relief score. If I graph the data showing both genders, though:
I now clearly see the effect of drug on pain relief depends on gender. This is a significant interaction despite no main effect.
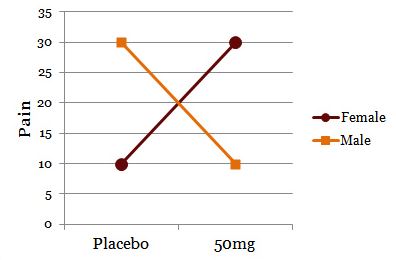
Consider this example:
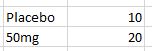
The drug appears to have a main effect because 50mg results in more pain relief than placebo. To simply collapse the data across gender and claim a main effect, though, shows only part of the story:
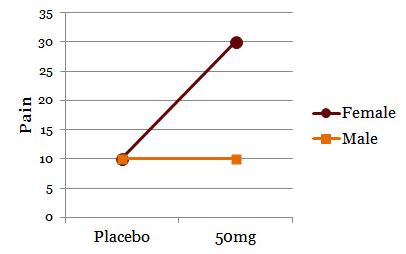
The effect of drug on pain relief clearly depends on gender. For men or women, the drug has no effect or helps, respectively.
While these are 2-way interaction effects, higher-order interaction effects can occur between three or four variables. A 3-way interaction is a 2-way interaction that varies across levels of a third variable. A 4-way interaction is a 3-way interaction that varies across levels of a fourth variable. These get harder to conceptualize as the number of factors increases.
Interaction effects limit generalizability of main effects. I can easily comprehend “A causes B.” An interaction effect means I must qualify: “A causes B, but only when C is… [high or low].”
From a statistical standpoint, my crude oil study does not make for an easy analysis. I am interested in the four factors of strategy quality (best vs. worst), number of rules (two vs four), training period (OOS beginning vs end), and trade direction (long vs. short). With regard to interaction effects, I have seen written in multiple places that 4-way and even higher-order interactions are very difficult to interpret and are rarely meaningful.
Rather than attempting a 4-way analysis of variance (ANOVA: a statistical test), I could run four 3-way ANOVAs or six 2-way ANOVAs. This would simplify interpretation of interaction effects. What doesn’t change, however, is the fact that I am still looking at the effects of four different factors. A 3-way or 4-way interaction is still possible regardless of whether my statistical test has the capability of measuring it. I wonder if I am just blocking out part of my visual field in order to better understand what I do see, which may not be the most legitimate course of action.
I will continue next time.
Categories: System Development | Comments (0) | PermalinkWhy is Curve Fitting Such a Bad Word?
Posted by Mark on August 17, 2020 at 06:48 | Last modified: May 12, 2020 07:29I have been trying to get more organized this year by converting incomplete drafts into finished blog posts. Some of these are from out in left field, but I am publishing them anyway on the off chance someone might be able to benefit.
In the second paragraph here, I said “optimization” is sometimes a bad word. It is specifically a bad word when used to mean curve fitting, which relates back to this draft I wrote in July 2019.
—————————
Is it curve-fitting or curve fitting? Whatever it is, it’s a bad word when used in these parts.
The process of curve fitting, though, is not a bad process but rather a branch of mathematics.
Wikipedia gives us:
> Curve fitting[1][2] is the process of constructing a curve, or
> mathematical function, that has the best fit to a series of data
> points,[3] possibly subject to constraints.[4][5] Curve fitting
> can involve either interpolation,[6][7] where an exact fit to
> the data is required, or smoothing,[8][9] in which a “smooth”
> function is constructed that approximately fits the data. A
> related topic is regression analysis,[10][11] which focuses
> more on questions of statistical inference such as how much
> uncertainty is present in a curve that is fit to data observed
> with random errors. Fitted curves can be used as an aid for
> data visualization,[12][13] to infer values of a function where
> no data are available,[14] and to summarize the relationships
> among two or more variables.[15] Extrapolation refers to the
> use of a fitted curve beyond the range of the observed data,
> [16] and is subject to a degree of uncertainty[17] since it
> may reflect the method used to construct the curve as much
> as it reflects the observed data.
When used without validity, curve fitting turns bad. Looking to the past for viable strategies with the hope of applying them in the future makes sense. However, the past is unlikely to match the future and I have no idea of knowing how similar the two may be. The more I try to curve fit a strategy to the past, the less likely it is to work in the future.
The true goal of trading system development is to provide enough confidence to stick with a strategy through times of drawdown in order to realize future profit (see end of third paragraph here). However, if the strategy is poorly suited for the future because it is curve fit to the past then I will definitely lose money trading it. Curve fitting is a bad word in this respect.
Categories: System Development | Comments (0) | PermalinkCrude Oil Strategy Mining Study (Part 2)
Posted by Mark on August 14, 2020 at 07:36 | Last modified: July 13, 2020 10:12Last time, I detailed specific actions taken with the software. Today I will start with some software suggestions before continuing to discuss my latest study on crude oil.
This backtesting took over 30 hours. For studies like this, implementing some of the following might be huge time savers:
- Allow execution (e.g. Monte Carlo analysis, Randomized OOS) on multiple strategies from the Results window at once.
- Offer the option to close all Results windows together* since each Results exit requires separate confirmation.
- [Alternatively] Allow multiple [strategy] selections to be retested on a particular time interval and create one new Results window with all associated data. This would save having to re-enter a new time interval [at least two entries for year, in my case, and sometimes 3-4 entries when a month and/or date got inexplicably changed. This occurred 4-8 times per page of 34 strategies during my testing] for each and every retest in addition to saving time by closing just one Results window per page (rather than per strategy).
- Include an option in Settings to have “Required” boxes automatically checked or perhaps even better, add a separate “Re-run strategy on different time interval” function altogether. Retesting a specific 4-rule strategy involves checking “Required” for each rule, but testing the same strategy on different time intervals encompasses “Required.”
- Offer the option to close all open windows (or same-type windows like “close all Monte Carlo Analysis windows?” “Close all Randomized OOS windows?”) when at least n (customizable?) windows are already open. Exiting out of non-Results windows can take noticeable time when enough (80-90 in my case) need to be consecutively closed.
My general approach to this study is very similar to that described in Part 6:
- Train over 2011-2015 or 2007-2011 with random entry signals and simple exit criteria.
- Test OOS from 2007-2011 or 2011-2015, respectively (two full sets of strategies).
- Identify 34 best and 34 worst performers over the whole 8-year period for each set.
- Retest over 2015-2019 (incubation).
- Re-randomize signals and run simulation two more times.
- Apply the above process to 2-rule and 4-rule strategies.
- Apply the above process to long and short positions.
- Include slippage of $30/trade and commission of $3.50/trade.
In total, I recorded incubation data for 2 * 34 * 2 * 3 * 2 * 2 = 1,632 strategies in this study: 816 each were long/short, 2-rule/4-rule, best/worst strategies, and OOS beginning/end (each category is itself mutually exclusive, but categories are not mutually exclusive of each other). I enter data with relative speed and accuracy, but mistakes can definitely be made. As another study improvement over the last, I therefore ran some quality control checks:
- Compare NetPNL and PNLDD for sign alignment (e.g. both should be positive, negative, or zero).
- Compare NetPNL and Avg Trade for sign alignment.
- Compare NetPNL and PF for alignment (if NetPNL < 0 then PF < 1; if NetPNL > 0 then PF > 1).
- Compare PNLDD and Avg Trade for sign alignment.
- Compare PNLDD and PF for alignment.
- Compare Avg Trade and PF for alignment.
- Verify that Avg Trade ~ (NetPNL / # trades).
- Screen PF for gross typos (e.g. 348 instead of .48; extremes for all occurrences ended up being 0.22 and 2.37).
I will continue next time.
* — This may be difficult because I want only the re-run Results windows—not the
whole simulation Results window closed. Perhaps this could be offered in Settings.
I have written elsewhere (paragraphs 4-5 here) about the potential utility of
retesting strategies on separate time intervals; this might be a widely appreciated
feature by algo traders.
Crude Oil Strategy Mining Study (Part 1)
Posted by Mark on August 11, 2020 at 07:56 | Last modified: July 13, 2020 10:13Today I continue a blog mini-series focused on putting context around trading system development. I am trying to better understand what can be expected from strategies that look good in the developmental phases.
With each subsequent study, I am discovering nuances and better learning the software. My previous study is described here. In the current study, I have attempted to compile pieces from previous studies and avoid earlier mistakes.
As I learn, the exact methodology varies from study to study. I previously studied equities while I now move forward with crude oil. The following study is my first to include a dedicated stop-loss. What follows is also my first study featuring a highest high (lowest low) stop for long (short) trades. Subsequent studies may not include these. Regardless of the differences, my ultimate goal is to walk away with some big-picture conclusions based on recurring themes found inside the numbers.
Full details on the following study is included in Mining 8, but I will go into extensive detail here.
My process with the software was very repetitive:
- Enter correct settings (e.g. long/short, HHV/LLV stop, 2/4 rules, OOS at beginning/end), clear and select Random 1000 entry signals, and remove signals in Time category.
- Run continuous simulation x 5′.
- Sort by All: PNLDD and screenshot worst [34*] strategies.
- Eye results to make sure no duplicate strategies included (discard and replace).
- Transcribe 34* strategy numbers into spreadsheet.
- Sort by All: PNLDD and screenshot best [34*] strategies.
- Eye results to make sure no duplicate strategies included (discard and replace).
- Transcribe 34* strategy numbers into spreadsheet.
- Select “Re-run strategies with adjustments,” adjust backtest dates, and [4-rule strategies only] require all rules.
- Maximize Results window, right click x2,* and select “All.”
- Group together first six* Results windows then every four thereafter with first on top, second below top row of overall Results window (seen in background), and subsequent windows somewhere below.
- Once all 34 re-runs complete, select Results windows four (six for first group) at a time and sequentially drag on screen with Net PNL vertically aligned.
- With four (or six) tiled on screen,* drag Excel spreadsheet directly below fourth Results window and transcribe Net PNL, PNLDD, # trades, Avg Trade, and PF.
- With six tiled, transcribe stats for first four, drag spreadsheet just above Results windows 5-6, transcribe stats for these, and close out 5-6.
- [Drag spreadsheet below fourth Results window if six originally tiled and] Close out Results windows 1-4.
- Run Randomized OOS, noting in spreadsheet strategies that pass two consecutive runs (second paragraph here).
- Run Monte Carlo (MC) analysis, noting in spreadsheet strategies with resample average DD less than backtested DD (seventh paragraph here).
- Close all MC and Randomized OOS windows.
- Sort by All: PNLDD worst to best.
- Repeat Randomized OOS and MC analysis steps for worst strategies then close all associated windows.
- Repeat steps for re-running strategies over incubation and transcribe OOS2 (third bullet point) performance stats.
- Re-randomize entry signals, remove time-related signals, and enter or check to make sure correct settings still entered.
- Rinse and repeat.
I will continue next time.
* — Many of these steps are reflective of my particular screen size, resolution, etc.