What Percentage of New Traders Fail? (Part 3)
Posted by Mark on April 17, 2020 at 12:23 | Last modified: May 16, 2020 15:47Today I continue with excerpts from a Forex website forum discussion in 2013. The initial post, which tries to rebuke traditional wisdom, is Post #1 here. Forum content is unscientific and open to scrutiny. Do your own due diligence and buyer beware.
—————————
• Post #21, Jean:
> The figures don’t show by how much the accounts
> are profitable. Perhaps many are just slightly up in
> % from the start of each quarter, and perhaps all the
> slow and steady growth account holders don’t hang
> out at net forums. Maybe the “95/99% of traders
> lose” is inaccurate and really just a collective
> anger/stressed/disbelief based view of this business
> as so many guys that are both clever and dedicated
> spend years at this and don’t cash in, but spend
> a lot of time together on forums and collectively
> agree on a 95-99% figure…?
• Post #22, Slim:
> Those statistics don’t really mean much as far as
> I’m concerned. Certainly, there will be a lot of
> traders who jump in for three or four months and
> quit. That significantly reduces the “success rate”.
>
> Trading is a profession (think doctor or lawyer).
> You don’t have to go to college to be a good trader
> but you’ll get your “trading degree” one way or
> another [with tuition paid to the market].
>
> Most professionals spend years learning their
> profession. What would be the success rate of a
> surgeon after 4 months of learning? Some can
> probably be a good trader in far less time than
> it takes to be a surgeon but the idea is the same.
>
> Individual retail traders have the added burden
> of becoming entrepreneurs—like an attorney going
> into private practice rather than working for a firm.
>
> I would imagine that the success rate for traders
> who take the time to learn and decide to stick with
> it isn’t so different as the success rate for other
> businesses: ~18 – 20%. You really can’t judge the
> success/failure rate solely by the stats required
> by the CFTC.
• Post #28, Dye:
> Yet more and more people are still buying into this
> long held rumor?? based on what facts? I would like
> to see some stats other than broker numbers that
> can be manipulated just like the price. With a
> market that is so random how can we have such a
> firm number of losers to winners.
• Post #29, Cold:
> It makes no sense and I don’t buy it at all. Maybe
> not 99% but more than 70%. I’ve been in the business
> since 2003 and I can confirm from my own experience.
• Post #30, Slim:
> The fact is, PEOPLE WILL BELIEVE WHAT THEY WANT
> TO BELIEVE regardless of whether there’s anything to
> substantially support the belief.
>
> I think I would have to agree with Cold: more than
> 70% fail. However, I would like to know the success
> rate of those who have toughed it out for at least
> 3 years. I can only guess that the success rate gets
> a little better.
I wonder what Cold and Slim would think about the Brazilian day trading study?
To be continued…
Categories: Financial Literacy | Comments (0) | PermalinkWhat Percentage of New Traders Fail? (Part 2)
Posted by Mark on April 14, 2020 at 11:20 | Last modified: May 16, 2020 15:15Today I continue with excerpts from a 2013 Forex website forum discussion. The initial post (#1), which tries to rebuke traditional wisdom, is seen here.
Forum content is never scientific and always open to scrutiny. Do your own due diligence and buyer beware.
—————————
• Post #6, Raz:
> Even if 99% isn’t accurate (let’s say it’s actually 90%:
> doubtful though) I believe it’s better for a newbie
> to hear the number 99%. Those who can make it
> already know they are in the 1%, and for the others I
> believe it’s good for them to realize Forex is not a
> sure thing and not to quit their day job over.
>
> Of course scammers like you would like people to
> believe they can make 9000$/day (NO EXPERIENCE,
> NO WORK REQUIRED, right?) but that’s just not true.
>
> I’m sick of Forex ads that say “Hi, i’m Rosie and a
> week ago I used to clean toilets… but then I found out
> about Forex. Now I drive a Ferrari! You can do it too!
> Quit your job, sell your house, fill your account and
> sooner then you know it you’ll be a billionaire too!”
>
> It’s a disgrace for brokers and for traders: makes it
> all seem like a scam.
Enter mention of scam. This is commonly seen in forum posts and often discussed on my blog as well. The possibility is out there and the likelihood exists: people just choose to ignore it.
• Post #7, Bab:
> It’s said that failure is not when you fall per se.
> Failure is when you fall and fail to get up again.
> The perception that 90% of traders failed is that
> they blew up but did not rise again or did not “try,
> try, till you succeed.” The 10% successful are those
> who rose after falling. They might have fallen many
> times and learned valuable lessons each time to move
> forward. Failure is experience that can lead to
> success. The brokers figures, if true, might portray
> active traders with a huge amount that have not
> gotten up and therefore gone inactive. This might
> further dilute the successful in a ratio of 1:9.
>
> If these figures are depressing to the new trader,
> then make use of demo accounts to fail virtually.
> Read, learn, understand, and practice for days,
> months, or years on the DEMO. Get experienced and
> succeed with your strategy on DEMO. Eventually, go
> live in small steps, risk only what you can afford
> to lose, and apply strict money management. You
> too can be an elite success.
>
> Good Luck to all who pursue this trading endeavor
> and to those who have almost reached success.
I think there are some good recommendations here.
• Post #8, prak:
> From what I understand the % winning is based on
> balance increase over the quarter. As Oanda pays
> interest on accounts, any account sitting there
> doing nothing went up and therefore is profitable.
>
> The results do not show the trader that makes
> money in one quarter but then blows up the next.
> Just because 20% made money in one quarter does
> not mean any are profitable overall.
• Post #9, jean:
> If any of you are wondering about the NFA retail
> broker client profitability calculation, instead
> of guessing just read this.
>
> After consultation with CFTC staff, NFA provides
> the following information:
>
> “The calculation, including determining the total
> number of non-discretionary retail forex customer
> accounts maintained by the RFED and FCM that
> quarter (Q), should include only accounts that
> executed trades during the Q and/or had an open
> position at any time during the Q. Accounts without
> trades or open positions during the Q should not be
> included in the calculation regardless of whether
> the account maintained a cash balance and/or was
> paid interest or charged any fees during the Q.”
• Post #18, Ekl:
> It will be interesting to see the profitability with
> the filter of at least one trade during the Q. I
> would suspect many accounts are profitable on
> account of accrued interest and not winning trades.
To be continued…
Categories: Financial Literacy | Comments (0) | PermalinkWhat Percentage of New Traders Fail? (Part 1)
Posted by Mark on April 9, 2020 at 10:44 | Last modified: May 16, 2020 15:17I have been interested in the title topic ever since I started trading. I recently stumbled upon an academic paper that analyzed futures day trading in Brazil. The results were fascinating.
What follows are excerpts from a forum discussion I found on a Forex website back in 2013. Forum content is never scientific and always open to scrutiny. Do your own due diligence and buyer beware.
—————————
Here is the initial post:
• Post #1, Wpr:
> Often, I hear mentionined how 95% – 99% of all new
> traders fail. This type of misinformed information
> in my opinion is very misleading and damaging to the
> psyche of those trying to learn how to trade forex.
>
> First the facts.
>
> Brokers inside the USA are now required by the CFTC
> to release the percentage profitability rates along
> with the number of active traders. While the
> following numbers focus on USA, traders worldwide
> should be the same.
>
> The true percentage of profitable traders
> • Oanda has ~50,000 active traders
> • IBFX has 18,579 active traders
> • FXCM has 15,023 active traders
> • Gain has 11,344 active traders
> • GFT has 10,358 active traders
>
> 51% of Oanda traders were profitable in Q3. Others
> are far lower: GFT at 33% and the rest 21% – 29%.
>
> These numbers destroy the myth that 95% – 99% of
> traders are not profitable.
>
> Why this matters to those trying to learn to trade:
>
> If you are told ahead of time that your odds of
> success are extremely rare (knowing that you are
> competing against some of the brightest minds in
> the world), your chances of success are greatly
> diminished compared to if you believed that others
> have succeeded and that you can too.
>
> You can become a profitable trader. A large
> percentage of others have proven it and are doing
> it on a quarterly basis. Believe in yourself:
> many before you have done this and you can too.
>
> Collectively, let’s change the consciousness to a
> positive light enabling more to succeed.
>
> Your thoughts and opinions are welcomed friends.
• Post #2, Fnuts:
> For starters, what metrics do these brokers use to
> rate profitability? What specs? What accounts? Mere
> % is not going to convince anyone here. And
> profitable forex trading takes time and a lot of
> effort on the part of a trader, it’s not slam dunk as
> you make it sound..
>
> Either way, seeing how brokers tend to fudge details
> and have been doing so for some time now, not going
> to trust any % cruncher the brokers may have set up…
• Post #3, XTr
> Were Q1, Q2, and Q4 profitable?
>
> 50% is a breakeven number. You are also getting this
> info from the party itself not an outside source.
>
> Maybe not 95%, but yes 90% of new FX traders FAIL.
>
> FACTS:
>
> 1. Not enough experience trading live money
> 2. Undercapitalization
> 3. Over-leveraging
> 4. Overtrading
> 5. Shady broker practices
> 6. Insufficient understanding of markets let alone FX
> 7. No detachment from emotion and money
>
> Ask any experienced trader on this forum if they have
> HONESTLY ever blown up an early account and the answer,
> nine times out of 10, will be YES.
>
> What makes you think that these “profitable traders”
> aren’t just dumping more and more money into their
> accounts after losing?
To be continued…
Categories: Financial Literacy | Comments (0) | PermalinkCustody Rule
Posted by Mark on March 31, 2020 at 07:04 | Last modified: May 15, 2020 10:58Today I go into more detail about the Custody Rule, which I first introduced here.
Custody fits into my world as described in this fourth paragraph. If I want to start managing wealth for others, then do I want to pursue work as an Investment Adviser [Representative] (IA) or hedge fund? Do I want to trade in SMAs (Appendix A, third paragraph)? Part of me doesn’t want the trouble of holding onto others’ money, and I would strongly suggest others not give their money over to anyone else.
From a legal perspective, custody is a complicated issue. Anyone [thinking about pursuing] working in the financial industry usually gets a question(s) about custody on the Series exams. If you are thinking about hiring a wealth manager or investing in a [hedge] fund, then custody should be understood to protect yourself.
Custody is a big deal because much fraud in the advisory business could be avoided if client assets were never turned over in the first place. This pertains to smaller operators. Don’t give your money to someone you met through a friend of a friend: you may never get it back. Full-service financial firms with a bank, IA, insurance company, recognizable brand name, etc., are okay. Custody is natural to have for an IA that is an affiliate of a large bank or broker-dealer, too.
I will now explain custody and detail some regulations surrounding it.
An IA has custody of client assets when the adviser actually holds funds/securities or can appropriate them. If the adviser can automatically deduct funds from the client’s account or write checks out of the account, then the advisor has custody of client assets. If the adviser has an ownership stake in the entity (e.g. broker-dealer) who maintains custody, then the adviser has custody of client assets. If the adviser is the general partner in a limited partnership or a managing member of an investment LLC, then the adviser has custody of client assets.*
Regulation of IAs is conducted through the state securities Administrator and/or the Securities and Exchange Commission.
By law (Uniform Securities Act), an IA must first discover whether the Administrator has any rule prohibiting custody of client assets. Custody should not be taken if such a rule exists.
When an IA takes custody, the Administrator must be notified in writing promptly. Promptly is not immediately nor is it months to years. Promptly is a reasonable amount of time and probably open to interpretation. I would not feel comfortable trying to unnecessarily try to drag this out.
Custodial IAs must maintain a higher minimum net worth, must provide an audited balance sheet to regulators and to clients, and must pay an independent CPA to conduct a surprise audit once per year. If the CPA cannot decipher securities and cash positions from the books and records, then the CPA is to notify the regulators promptly.
If an IA inadvertently receives client securities in the mail, then securities must be returned to sender within three business days to avoid IA being deemed as having custody. IA should also keep records explaining what happened to avoid having to maintain a higher net worth, having to get an expensive CPA audit, and having to update its registration information.
If an IA receives check from client payable to third party, then similar steps must be taken to avoid IA being deemed as having custody. First, third party must not be an affiliate of the IA. Second, check must be forwarded to third party within three business days. Finally, advisor must keep records as to what happened.
Custody is not just a minor inconvenience: it’s a bona fide PITA. Most IAs avoid it; banks and broker-dealers who provide custodial services often do so for a reasonable charge.
* — A fuller description would go into more detail about broker-dealers and corporate structure.
Black Swan Trading Systems
Posted by Mark on February 27, 2020 at 07:02 | Last modified: May 8, 2020 11:03I have been going through my “drafts” folder this year trying to get more organized by finishing partially-written blog posts. Discussion in this post led to my thoughts on this from Sep 2018.
—————————
For me personally, I think the small sample size is still a
problem and it may be the reason why I’d be skeptical
that any statistically valid Black Swan system could
really be developed.
Ultimately, how could such a system ever be said to be
better than luck? Even if it hits the next one, two, or
three market crashes (over how many years or decades
would that take?), the sample size is still very small.
I think this is why I personally have never endeavored
to pursue development of such a system. This would also
be the root of my skepticism if I ever saw one.
I would offer up the caveat that from a practical
standpoint, hitting big on even one market crash could
make a boatload of money regardless of whether lucky
or not. I’m definitely not saying it’s a wasteful
pursuit: only one incapable of statistical validation.
Rather than developing such a directional system, I
wonder about having some long put insurance on
at all times. The insurance will lose a small amount
most of the time. Rarely, the insurance will pay
off big. Even if the total return is negative, lowering
the max drawdown of bullish strategies may still make
it a worthwhile addition (demonstrating this through
backtesting would probably face the same challenges
that I mentioned above, though). In addition, I could
always advertise “if the market goes to zero, the
system will profit handsomely.”
Musings on Naked Puts in Retirement Accounts (Part 5)
Posted by Mark on February 24, 2020 at 06:20 | Last modified: May 8, 2020 09:15I’ve been going through my “drafts” folder this year trying to finish partially-written blog posts and get more organized. The four-part mini-series ending with this post was an excellent discussion about naked puts (NP) versus vertical spreads with regard to leverage and volatility of returns. As I have said before [and I especially mean it this time], in the longshot case that someone out there could possibly benefit, what follows is Part 5 from August 4, 2017.
—————————
If I were paying someone to manage my money, then I would rather less of my capital be traded with a high degree of leverage. This is synthetically equivalent to more capital being traded with much of it in cash except I would not be paying a management fee on idle cash. [1]
One future direction for research is how standard deviation of returns and max drawdown compare to NPs from a gross dollar perspective if I lever up with vertical spreads. Given that employment of leverage will significantly decrease notional risk, what would be the comparable position size?
I suspect research cannot answer the question of proper position size to use because we never know when/if that large market crash will occur and the number of historical occurrences of said “large market crashes” is too small (see third paragraph here) for future indication.
Spreads are also harder to trade than single options so I might lose something additional to transaction fees. If I were just counting on the long option to protect from catastrophic loss, though, then that really doesn’t matter and the only question would be when to close it, which I briefly discussed in the fifth paragraph here.
—————————
I no longer agree with [1] for a couple reasons.
Most investment advisors (IA) would not trade retail accounts with a high degree of leverage. First, it is risky and not suitable for most investors. Second, for this reason most IAs probably know very little about trading with a high degree of leverage especially with regard to futures and options. Sticking with more conventional, existing products, leveraged ETFs exist but are only recommended in narrow circumstances. Again, I’m guessing it would be difficult to find IAs with expertise in this area.
Finally, trading in a leveraged manner may require cash to be left in the brokerage account unless one plans to actually take out a margin loan and pay margin interest. The one thing I know for certain in this scenario is that headwinds are against me. For this reason, I cannot recommend it.
Categories: Financial Literacy | Comments (0) | PermalinkDissection of an Investment Presentation (Part 3)
Posted by Mark on June 11, 2018 at 06:28 | Last modified: December 25, 2017 10:28Today I continue studying the investment presentation referenced here.
> …important characteristics of the momentum and value factors
> is their negative correlation… meaning value tends to work well
> when momentum is not… and momentum works well when value is
> idle. So each factor adds value on a standalone basis but
> their negative correlation makes them an excellent combination
> for potentially increasing risk-adjusted returns.
“Negative correlation,” which is arguably the “Holy Grail” of diversification, is a great marketing buzz phrase.
One problem is that correlation changes over time. During some of the most severe market declines, negative correlations have turned positive and approached +1.00. This means everything loses. The presentation says from 12/31/1926 – 12/31/2014, correlation of value and momentum was -0.40. This doesn’t tell us how things look at the extremes (when correlation becomes most positive) or what the overall distribution looks like (how often the negative correlation persists). An unstable parameter with large mean excursions coinciding with big losses is probably not a viable trading concept.
At worst, this could completely invalidate momentum and value factors as edge provided by their investing approach.
Here is their graph of factor performance:
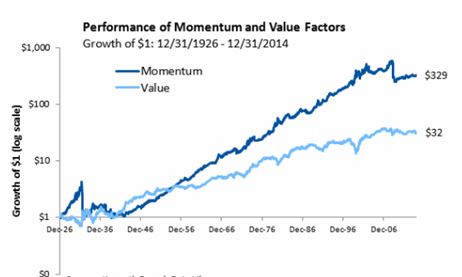
Over 88 years, $1 grows to $329 and $32 for momentum and value factors, respectively. That sounds impressive!
This is a good time to review my general recommendations for viewing an investment presentation:
- Do not be blinded by the light: their job is to make things look good.
- Accept no comparison without assessing the comparator.
- Challenge everything.
- Do not accept any claims without supporting evidence (added after Part 3).
No available comparator violates #2. We cannot see how the investment performed when not tailored toward momentum or value. A terminal value of $350, for example, would be reason to reject both factors.
Drawdown (DD) analysis is important enough to render any presentation lacking it very limited in application. DDs determine whether we can remain invested in a strategy. I have written about the importance of DDs here, here, here, and here.
With regard to #3, I see the graph omits DD analysis by showing growth of $1. The account would never actually start with $1 and the maximum DD of both curves may even exceed the initial value. Any such equity curve would, in reality, be terminated early due to Ruin (account going to zero).
In other words, growth of $1 to $350 simply would never have happened. The initial account would need to be larger to trade this strategy over the entire 88 years. Adding initial equity dilutes returns. Instead of 35,000%, realistic growth could be 3,500%, 350%, or less. The bloom is off the rose.
The presentation continues with this slide:
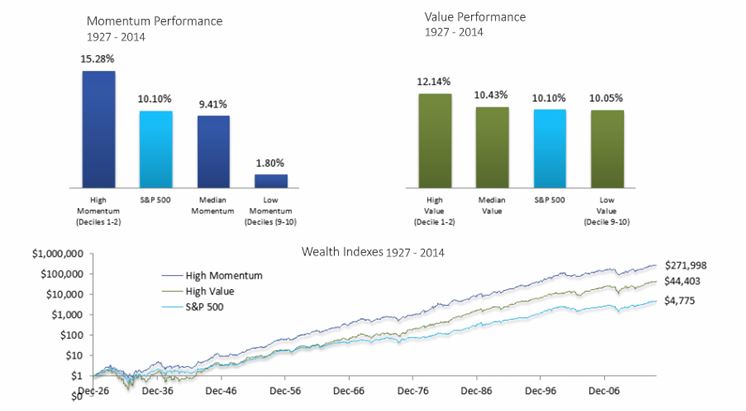
For me, the line graph begs an immediate question: how does this line graph differ from the first one? Both graphs show value and momentum factors. Both show growth of $1. Both cover a similar time interval. Why does momentum in the latter graph only grow to $272 (rather than $329) while value grows to a whopping $44 (rather than $32)? Those are huge differences for a subtraction of one year (or less), which is only a 1.1% difference on 88.
I also wonder why the time intervals are different at all. The first graph is “12/31/1926 – 12/31/2014” and the second is “1927-2014.” Were they just sloppy in reporting the same time interval? If they used the same interval then what/why was the difference in how they defined factors? Did they do their own research or “borrow” data from others?
Consistency breeds credibility and [especially] when consistency is lacking, explanation should be given. None is given here, which violates #4. I question the accuracy of their calculations. I also question their underlying motives. Were they trying to artificially inflate certain numbers to serve their purpose? Remember #1, above.
Categories: Financial Literacy, optionScam.com | Comments (0) | Permalink