LULU Stock Study (4-18-24)
Posted by Mark on April 10, 2024 at 07:45 | Last modified: April 18, 2024 08:31I recently did a stock study on Lululemon Athletica Inc. (LULU, $344.86). Previous studies are here and here.
M* writes:
> Lululemon Athletica Inc. designs, distributes, and markets
> athletic apparel, footwear, and accessories for women, men,
> and girls. Lululemon offers pants, shorts, tops, and jackets
> for both leisure and athletic activities such as yoga and
> running. The company also sells fitness accessories, such
> as bags, yoga mats, and equipment. Lululemon sells its
> products through more than 680 company-owned stores in
> 19 countries, e-commerce, outlets, and wholesale accounts.
This medium-size [not for much longer] company has grown sales and EPS at rates of 20.9% and 24.2% per year since 2015 (FY ends 1/31). Lines are mostly up (EPS dips in ’18, ’21, and ’23), straight, and parallel. PTPM over the last 10 years leads peer and industry averages while ranging from 16.4% in ’23 to 22.6% in ’24 with a last-5-year mean of 20.3%.
ROE over the last 10 years is roughly equal to industry averages while outpacing peers, ranging from 16.8% in ’18 to 43.7% in ’24 with a last-5-year mean of 34.8%. Debt-to-Capital is zero through 2018. This remains much lower than peer and industry averages as the company maintains no long-term debt. The last-5-year mean is 25.2% (leases).
Current Ratio is 2.49 and Quick Ratio is 1.68. Value Line rates the company “A+” for Financial Strength and M* gives an “Exemplary” rating for Capital Allocation. M* also assigns Lululemon a “Narrow” economic moat.
With regard to sales growth:
- YF projects YOY 12.1% and 10.2% for ’25 and ’26, respectively (based on 29 analysts).
- Zacks projects YOY 11.9% and 10.8% per year for ’25 and ’26, respectively (12 analysts).
- Value Line projects 9.3% annualized growth from ’24-’29 (FY ends 1/31).
- CFRA projects 14.4% YOY and 14.9% per year for ’25 and ’24-’26, respectively.
- M* gives a 2-year ACE of 11.4% annualized growth.
I am forecasting below the range at 9.0%/year.
With regard to earnings growth:
- MarketWatch projects annualized growth of 12.9% and 13.2% for ’24-’26 and ’24-’27 (based on 35 analysts).
- Seeking Alpha projects 4-year annualized growth of 15.3%.
- YF projects YOY 10.8% and 11.9% for ’25 and ’26 (28 analysts), along with 5-year annualized growth of 12.3%.
- Zacks projects YOY 10.8% and 11.6% for ’25 and ’26, respectively (14), along with 5-year annualized growth of 20.0%.
- Value Line projects 15.8% annualized growth from ’24-’29 (FY ends 1/31).
- CFRA projects 13.5% YOY and 15.4% per year for ’25 and ’24-’26, respectively, along with a 3-year CAGR of 16.0%.
- M* projects long-term annualized growth of 18.8%
I am forecasting below the long-term-estimate range (mean of five: 16.4%) at 12.0% per year. My initial value will be the trendline $10.11/share because ’24 EPS ($12.20) is an 82.6% YOY spike and above historical trend.
My Forecast High P/E is 30. High P/E ranges from 37 (’16 and ’17) to 88.9 (upside outlier in ’21) over the last 10 years. The last 5-year mean (excluding ’21) is 54.7 and the last 5-year-mean average P/E is 42.8. I am forecasting well below the range.
My Forecast Low P/E is 25. Low P/E ranges from 20.7 (’19) to 37.7 (’23) over the last 10 years with a last-5-year mean of 30.9. I am forecasting just above the 10-year median low P/E of 24.7.
My Low Stock Price Forecast (LSPF) is the default of $252.80 based on $10.11/share initial value. This is 26.7% less than the previous close, 22.7% less than the 52-week low, and about equal to the 2022 low.
These inputs land LULU in the HOLD zone with an U/D ratio of 2.4. The Total Annualized Return (TAR) is 9.8%.
PAR (using Forecast Average—not High—P/E) is less than I seek for a medium-size company at 7.9%. If a healthy margin of safety (MOS) anchors this study, then I can proceed based on TAR instead.
To assess MOS, I compare my inputs with those of Member Sentiment (MS). Based on 173 studies done in the past 90 days (51 outliers and my study excluded), averages (lower of mean/median) for projected sales growth, projected EPS growth, Forecast High P/E, and Forecast Low P/E are 13.9%, 15.8%, 42.0, and 27.5. I am lower across the board. Value Line projects a future average annual P/E of 25.0, which is much lower than MS (34.8) and lower than mine (27.5).
MS high / low EPS are $21.24 / $10.27 versus my $17.82 / $10.11 (per share). My high EPS is lower due to a lower growth rate. Value Line’s high EPS is $21.00/share. I am lowest of the three.
MS LSPF of $268.00 implies a Forecast Low P/E of 26.1: less than the above-stated 27.5. MS LSPF is 5.1% less than the default $10.27/share * 27.5 = $282.43 resulting in more conservative zoning. MS LSPF is still 6.0% greater than mine.
My TAR (over 15.0% preferred) is less than MS 18.6%. I believe MOS to be robust in the current study.
Regarding valuation metrics, Relative Value [(current P/E) / 5-year-mean average P/E] per M* is low at 0.64. PEG is fairly valued per Zacks (an infrequent occurrence at 1.2) and 2.0 per my projected P/E.
I consider LULU to be “hitting it out of the park” relative to its industry and overall fundamentals. Analysts disagree about its valuation (e.g. overvalued per M* despite plenty of remaining growth potential versus Strong Buy per CFRA), but per relative P/E the stock has rarely been on sale like it is right now.
With some handicapping (i.e. low growth forecasts, trendline initial value, and very low Forecast High P/E), I have LULU a BUY under $323. With a forecast high price around $535, TAR should meet my 15% criterion around $267/share.
Categories: BetterInvesting | Comments (0) | PermalinkDEO Stock Study (4-17-24)
Posted by Mark on April 8, 2024 at 15:01 | Last modified: April 17, 2024 17:23I recently did a stock study on Diageo PLC ADR. (DEO) with a closing price of $136.03. My previous study is here.
M* writes:
> The product of a merger between Grand Metropolitan and Guinness
> in 1997, Diageo is one of the world’s leading producers of branded
> premium spirits, approximately level with Kweichow Moutai in
> revenue terms. It also produces and markets beer and wine. Brands
> include Johnnie Walker blended scotch, Smirnoff vodka, Crown Royal
> Canadian whiskey, Captain Morgan rum, Casamigos tequila, Tanqueray
> gin, Baileys Irish Cream, and Guinness stout. Diageo also owns 34%
> of premium champagne and cognac maker Moet Hennessy, a
> subsidiary of French luxury-goods maker LVMH Moet Hennessy-Louis
> Vuitton, and a near-56% stake in India’s United Spirits.
Over the past decade excluding 2020 (COVID-19), this large-size company has grown sales and EPS at annualized rates of 2.5% and 3.3%, respectively (2.2% and 1.8% including ’20). Lines are somewhat up, straight, and parallel with sales declining in ’15 and ’16 along with EPS declines in ’15, ’16, and ’21. A debate may ensue about whether this is high-quality growth. I listed several YOY declines. 2014 sales (EPS) is not eclipsed until ’21 (’18). In addition, some would say a large company with a sub-5.0% historical/projected growth rate is suspect.
Over the past decade, PTPM trails industry averages (peer data not available) while ranging from 26.4% in ’14 (excluding 17.4% in ’20) to 32.9% in ’19 with a last-5-year mean of 29.5%. ROE trails industry averages despite trending higher from 34.2% (’14) to 47.2% (’23) with a last-5-year mean of 39.3% (34.9% including ’20). Debt-to-Capital is lower than industry averages despite increasing from 58.2% (’14) to 68.4% (’23) with a last-5-year mean of 67.4%.
Interest Coverage is 5.8 and Quick Ratio is 0.6. Value Line rates the company “A” for Financial Strength and M* gives a “Standard” rating for Capital Allocation. M* also assigns Diageo a “Wide” economic moat.
With regard to sales growth:
- Zacks projects YOY 5.6% and 3.5% growth for ’24 and ’25, respectively (based on 5 analysts).
- Value Line projects 6.7% annualized growth from ’23-’27.
- CFRA projects contraction of 24.6% YOY and 9.9% per year for ’24 and ’23-’25, respectively (N.B.: “year” column does not add up for ’21-’24, inclusive).
- M* offers a 2-year ACE of 3.5%/year.
I am forecasting below the range at 3.0% per year.
With regard to EPS growth:
- MarketWatch projects 5.5% and 2.6% per year for ’23-’25 and ’23-’26, respectively (based on 23 analysts).
- Nasdaq.com projects 6.2% YOY and 8.9% per year for ’24-’26 and ’24-’27 [8, 5, and 1 analyst(s) for ’24, ’26, and ’27].
- Seeking Alpha projects 4-year annualized growth of 4.4%.
- YF projects 5-year annualized growth of 4.4% (rest of web page is either blank or “N/A”).
- Zacks projects YOY 8.7% contraction and 5.2% growth for ’24 and ’25, respectively (7), along with 5-year annualized growth of 5.7%.
- Value Line projects 3.8% annualized growth from ’23-’28.
- CFRA projects 9.6% and 9.2% per year for ’22-’24 and ’22-’25 (again, “year” column does not add up for ’21-’24).
- M* projects long-term growth of 9.1% per year.
My 3.0% forecast is below the range of five long-term estimates (mean 5.5%). The initial value is ’23 EPS of $8.29/share [much of the data from the website (automatically populated from M*) differs slightly from my previous First Cut (FC) on 10/13/23; for example, this read $7.91/share. I will point out other differences below].
My Forecast High P/E is 21.0. Over the past decade, high P/E ranges from 21.3 in ’14 [previous FC had 22.0 in ’15] to 32.9 in ’22 [previous FC had 32.4 in ’21] (2020’s 59.8—58.4 in previous FC—excluded) with a last-5-year mean of 28.5 and last-5-year-mean average P/E of 24.7. I am forecasting below the range.
My Forecast Low P/E is 13.0. Over the past decade, low P/E ranges from 17.7 in ’17 [previous FC had 18.0 in ’15] to 24.5 in ’22 [previous FC had 22.4 in ’22] (2020’s 34.1—33.3 in previous FC—excluded) for a last-5-year mean of 21.0. I am forecasting well below the range.
My Low Stock Price Forecast (LSPF) of $107.80 is default based on $8.29/share EPS. This is 20.8% less than the previous closing price and 20.5% less than the 52-week low.
Over the past decade, Payout Ratio ranges from 43.9% in ’23 [previous FC had 46.8%] to 71.6% [64.6%] in ’16 (2020’s 115.9% [117.0%] excluded) with a last-5-year mean of 53.6% [52.5%]. My 43.0% [46.0%} forecast is below the range.
These inputs land DEO in the HOLD zone with a U/D ratio of 2.2. Total Annualized Return (TAR) is 10.1%.
PAR (using Forecast Average—not High—P/E) of 6.1% is less than I seek for a large-size company. If a healthy margin of safety (MOS) anchors this study, then I can proceed based on TAR instead.
To assess MOS, I start by comparing my inputs with those of Member Sentiment (MS). Based on only 22 studies (eight outliers including my own excluded) over the past 90 days, averages (lower of mean/median) for projected sales growth, projected EPS growth, Forecast High P/E, Forecast Low P/E, and Payout Ratio are 4.8%, 6.0%, 25.3, 19.0, and 63.6%. I am lower across the board. Value Line’s projected average annual P/E of 19.8 is lower than MS (22.2) and higher than mine (17.0).
MS high / low EPS are $10.76 / $5.94 versus my $9.62 / $8.29 (per share). MS low EPS seems unreasonably extreme. $5.72/share would be the lowest since $5.61 [was $5.46 in previous FC] in 2017. Looking closer at MS, six studies (27.3% of the sample) use $0.00 as low EPS (definitely unreasonable). Excluding these raises the mean to $8.16, which is close to mine. My high EPS is lower due to a lower growth rate. Value Line’s high EPS is $10.00/share. I am lowest of the three.
MS LSPF of $131.70 implies a Forecast Low P/E of 22.2: greater than the above-stated 19.0. MS LSPF is 16.7% greater than the default $5.94/share * 19.0 = $112.86 resulting in more aggressive zoning [the large discrepancy is another suggestion that MS low EPS may be extreme]. MS LSPF is also 22.2% greater than mine.
My TAR (over 15.0% preferred) is less than the 15.8% from MS. MS sample size is too small to allow for a valid comparison alone. Based on input selection below or near the bottom of analyst and historical P/E ranges including LSPF less than multi-year lows, I believe MOS to be at least decent in the current study.
Regarding valuation metrics, Relative Value [(current P/E) / 5-year-mean average P/E] per M* is low at 0.67. PEG exceeds 3.2 (overvalued) per Zacks and my projected P/E. PEG is high enough to make me question whether it even applies here (gut feeling that I can’t logically explain).
Generally speaking, I have doubts about DEO partially due to data inconsistency. I don’t see anything historical or projected close to the 11.8% sales growth listed at Manifest Investing (“Bull Sessions” on Apr 2, 2024). Numbers don’t add up from CFRA. YF has mostly missing data. MS is wonky and while this is largely due to the low sample size resulting in a failure to exclude studies that would usually be outliers, having any studies with $0.00 EPS estimates is something I rarely notice.
Some would try to set me straight, but for me DEO’s frail EPS projections also don’t jive with a wide economic moat.
Maybe currency conversion from sterling to USD is injecting some fuzzy math into the mix. This should not be the case as indicated here: “[As of Jul 1, 2023, Diageo] decided to change its presentation currency to US dollars… applied retrospectively, as it believes that this change will provide better alignment of the reporting of performance with its business exposures.” This would be post hoc rationale in a post hoc press release that is mysteriously dated > 6 months (Jan 30, 2024) after the change. As an ADR trading on the NYSE, I don’t have 10-K’s for clarification.
I lowballed Forecast Low P/E to get LSPF more than 20% below the current price (a minimum I try to uphold). The highest dividend yield over the last 10 years is 3.4% in ’16. With the current annual dividend of $4.01/share, any stock price below $116.90 would push the dividend yield > 3.4%. This is an argument to use a higher LSPF thereby raising U/D to 3.1.
As I have it, though, DEO is a BUY under $131. With a forecast high price around $202, TAR should meet my 15% criterion around $101/share.
Categories: BetterInvesting | Comments (0) | PermalinkNAPA Stock Study (4-16-24)
Posted by Mark on April 4, 2024 at 09:05 | Last modified: April 17, 2024 15:09I recently did a stock study on Duckhorn Portfolio Inc. (NAPA) with $8.23 closing price. Previous studies are here and here.
Value Line writes:
> Duckhorn Portfolio, Inc. is an American producer and purveyor of wines
> from California and Washington state. The company operates approx.
> 900 vineyards, produces 900,000 cases per year. Major brands include
> Duckhorn, Decoy, Goldeneye, Paraduxx, Migration, Canvasback,
> Calera, Kosta Browne, Greenwing and Postmark. In the U.S., sells
> wines through wholesale distributors or directly to consumers in
> wineries and through a wine club membership.
This small-size company went public in 2021 and has financials available since 2019. Over that time, Duckhorn has grown sales and EPS at 14.4% and 33.4% per year, respectively. Lines are mostly up, straight, and parallel.
Over the past five years, PTPM leads (trails) peer (industry) averages while increasing from 12.4% (’19) to 23.4% (’23) with a last-5-year mean of 19.3%. Debt-to-Capital is down from 40.1% (’19) to 21.2% (’23) with a last-5-year mean of 28.8%.
ROE is lower than industry averages and about even with peers with a last-3-year mean of 7.3%.
Current Ratio is 6.8, Quick Ratio is 0.9, and Interest Coverage is 6.9. Value Line assigns a B+ rating for Financial Strength.
With regard to sales growth:
- YF projects YOY 0.1% and 11.1% for ’24 and ’25, respectively (based on 8 analysts).
- Zacks projects YOY 1.0% and 11.6% for ’24 and ’25, respectively (3 analysts).
- Value Line projects 6.8% annualized growth from ’23-’27.
- CFRA projects 0.3% YOY and 4.0% per year for ’24 and ’23-’25, respectively (6).
- M* gives a 2-year ACE of 1.8% annualized growth.
I am forecasting toward the lower end of the range at 3.0% per year.
With regard to EPS growth:
- MarketWatch projects 6.0% and 7.6% per year for ’23-’25 and ’23-’26, respectively (based on 9 analysts).
- Nasdaq.com projects 12.7% and 12.0% per year for ’24-’26 and ’24-’27 [3, 2, and 1 analyst(s) for ’24, ’26, and ’27].
- Seeking Alpha projects 4-year annualized growth of 3.4%.
- YF projects YOY 7.5% contraction and 11.3% growth for ’24 and ’25, respectively (8), along with 5-year annualized growth of 5.0%.
- Zacks projects YOY 6.0% contraction and 7.9% growth for ’24 and ’25, respectively (3), along with 5-year annualized growth of 2.0%.
- Value Line projects 6.1% annualized growth from ’23-’27.
- CFRA projects 6.7% YOY and 7.2% per year for ’24 and ’23-’25, respectively (7).
I am forecasting conservatively below the long-term-estimate range (mean of four: 4.1%) at 2.0% and using 2023 EPS of $0.60/share as the initial value.
My Forecast High P/E is 25.0. High P/E over the last three years (only data available) is 47.2, 48.6, and 32.3 (mean 42.7). The last-3-year-mean average P/E is 35.5. I am forecasting below the range.
My Forecast Low P/E is 11.0. Low P/E over the last three years (only data available) is 31.1, 33.1, and 20.7 (mean 28.3). I am forecasting well below the range.
My Low Stock Price Forecast (LSPF) of $6.30 is default based on $0.60/share initial value. This is 23.4% less than the previous close and 22.2% less than the 52-week low.
These inputs land NAPA in the BUY zone with a U/D ratio of 4.3. Total Annualized Return (TAR) is 15.0%.
PAR (using Forecast Average—not High—P/E) of 7.7% is less than I seek for a small-size company. If a healthy margin of safety (MOS) anchors this study, then I can proceed based on TAR instead.
To assess MOS, I would normally look to Member Sentiment except only two studies besides my own have been done over the past 90 days. Mine does have the lowest projected sales and EPS growth along with the lowest Forecast High and Low P/E. Mine also has the lowest TAR. My Forecast High P/E is equal to Value Line’s.
My forecast high EPS is $0.77/share versus Value Line’s $0.88/share.
My study appears to have a solid MOS except for a questionable Forecast High P/E. At 25, I’ve gone below the [brief 3-year historical] range and matched Value Line’s projection. This is a 73% increase from current, though: with what catalyst? As the Value Line analyst writes, “the stock lacks a reliable nexus for its valuation at this juncture.”
Relative Value [(current P/E) / 5-year-mean average P/E] per M* is very low at 0.41.
The stock is trading near its 52-week low and has been in a downtrend since the start of 2022. Value Line’s prospects on stock price [turnaround] are bright and its low projection of $17/share is just above my $16.60. These prospects don’t seem to align with anemic growth projections. ROE seems stuck around 9%, which doesn’t impress me either.
Despite the lackluster growth forecast, NAPA is a BUY under $9.50 and meets my 15% TAR criterion right now.
Categories: BetterInvesting | Comments (0) | PermalinkFIVE Stock Study (4-15-24)
Posted by Mark on April 2, 2024 at 14:49 | Last modified: April 15, 2024 16:31I recently did a stock study on Five Below, Inc. (FIVE) $157.48. Previous studies are here and here.
M* writes:
> Five Below Inc is a specialty value retailer offering merchandise targeted
> at the tween and teen demographic. The Company’s edited assortment of
> products includes select brands and licensed merchandise.
Over the past decade, this medium-size company has grown sales and earnings at annualized rates of 20.5% and 23.0%, respectively. Lines are mostly up, straight, and parallel except for EPS declines in ’21 (inclusive dates 2/1/2020 – 1/31/2021 as FY ends 1/31) and ’23. PTPM leads peer and industry averages while ranging from 7.8% (COVID in ’21) to 12.9% (’22) with a last-5-year mean of 11.1%.
Also over the past decade, ROE leads peer and industry averages despite falling from 34.5% (’15) to 21.7% (’24) with a last-5-year mean of 22.7%. Debt-to-capital is lower than peer and industry averages with a last-5-year mean of 53.9%.
FIVE has no long-term debt (leases and uncapitalized rentals, only), a Current Ratio of 1.7, and a Quick Ratio of 0.6. Value Line gives a B++ rating for Financial Strength (“A” six months ago), and M* assigns a “Narrow” (“Wide” six months ago) Economic Moat
With regard to sales growth:
- YF projects YOY 13.6% and 16.0% for ’25 and ’26, respectively (based on 19 analysts).
- Zacks projects YOY 13.4% and 16.2% for ’25 and ’26, respectively (9 analysts).
- Value Line projects 16.1% annualized growth from ’24-’29.
- CFRA projects 13.8% YOY and 15.0% per year for ’25 and ’24-’26, respectively.
- M* offers a 2-year annualized ACE of 15.8%.
I am forecasting below the range.
With regard to EPS growth:
- MarketWatch projects 13.9% and 15.9% per year for ’24-’26 and ’24-’27, respectively (based on 24 analysts).
- Nasdaq.com projects 19.3% YOY and 18.7% per year for ’26 and ’25-’27 [9/9/3 analyst(s) for ’25/’26/’27].
- Seeking Alpha projects 4-year annualized growth of 19.7%.
- YF projects YOY 11.8% and 19.0% for ’25 and ’26 (19) along with 5-year annualized growth of 19.3%.
- Zacks projects YOY 12.0% and 19.3% growth for ’25 and ’26 (9) and 5-year annualized growth of 20.6%.
- Value Line projects annualized growth of 15.2% from ’24-’29.
- CFRA projects 13.3% YOY and 16.3% per year for ’25 and ’24-’26, respectively, and a 3-year CAGR of 7.0%.
- M* projects 5-year annualized growth of 25.0%.
I am forecasting below the long-term-estimate range (mean of five: 20.0%). My initial value will be ’24 EPS of $5.41/share.
My Forecast High P/E is 32.0. Excluding ’21, high P/E over the past decade ranges from 39.5 in ’16 to 54.4 in ’15 with a last-5-year mean of 53.6 and a last-5-year-mean average P/E of 40.1. I am forecasting below the range (close to current P/E).
My Forecast Low P/E is 20.0. Over the past decade, low P/E ranges from 20.2 in ’18 to 36.4 in ’15 with a last-5-year mean of 26.6. I am forecasting below the range.
My Low Stock Price Forecast (LSPF) of $119.00 is default based on $5.41/share initial value. This is 24.4% less than the previous close and 17.7% less than the 52-week low.
These inputs land FIVE in the BUY zone with a U/D ratio of 5.0. Total Annualized Return (TAR) is 17.2%.
PAR (using Forecast Average—not High—P/E) of 13.3% is solid for a medium-size company. If a healthy margin of safety (MOS) anchors this study, then I can proceed based on TAR instead.
To assess MOS, I compare my inputs with those of Member Sentiment (MS). Based on 195 studies (my study and 83 outliers excluded) over the past 90 days, averages (lower of mean/median) for projected sales growth, projected EPS growth, Forecast High P/E, and Forecast Low P/E are 14.9%, 16.3%, 37.4, and 25.3, respectively. I am lower across the board. Value Line’s projected average annual P/E of 30.0 is lower than MS (36.4) and mine (32.0).
MS high / low EPS are $10.89 / $4.84 versus my $10.88 / $5.41 (per share). My high EPS is in agreement while MS appears to be using low EPS from ’23 rather than ’24 released about one month ago. Value Line’s high EPS is $11.00: in agreement with the two others.
MS Low Stock Price Forecast (LSPF) of $126.60 implies a Forecast Low P/E of 26.2: more than the above-stated 25.3. MS LSPF is 3.4% greater than the default $4.84/share * 24.4 = $122.45, which results in more aggressive zoning. MS LSPF is also 6.4% greater than mine.
My TAR (over 15.0% preferred) is in good agreement with the 17.3% from MS. MOS seems robust in the current study since it agrees nicely with MS data seemingly based on ’23 annual EPS.
Regarding valuation metrics, PEG is 1.3 and 1.7 per Zacks and my projected P/E, respectively: the latter being overvalued. Relative Value [(current P/E) / 5-year-mean average P/E] per M* is slightly undervalued at 0.73.
FIVE is a BUY under $176 and with a forecast high price around $348, TAR meets my 15% criterion right now.
Categories: BetterInvesting | Comments (0) | PermalinkInvesting in T-bills (Part 19)
Posted by Mark on March 28, 2024 at 11:04 | Last modified: April 11, 2024 12:04I’ve covered a lot of quality detail in this mini-series involving T-bill investing, option trading, municipal bonds, and margin requirements. I will finish today tying up a few other loose ends.
Despite the title “Investing in T-bills,” some may actually consider it trading. As discussed in the fourth paragraph of Part 12, my bond-ladder structure requires a T-bill purchase every week. This may be deemed frequent for those who associate “investing” with long-term buy-and-hold (i.e. few required and/or infrequent transactions). I consider it investing in terms of maintaining an interest-generating vehicle over a longer-term period, but it does require a minimal time commitment.
Prior to the Part 8 revelation that overall option decay of synthetic long stock (SLS) substantially weakens its candidacy as a proxy for long shares, I had two other thoughts about taking advantage.
First, using only long calls instead of [together with short puts to form] SLS would limit the unlimited [to zero] downside risk. Something similar can be accomplished by purchasing roughly half the number of shares and using remaining free cash to invest in T-bills. The capital requirement of half the shares would still be greater than either long calls or SLS, but shares are not subject to the additional payment for time premium.*
Despite the weakened candidacy mentioned above, long calls carry a different risk profile than [SLS or] long stock; backtesting could be used to determine what strategy might be superior.
Second, SPX SLS may be a good proxy for any large-cap ETF or mutual fund. Edge realized by large-cap ETFs or mutual funds that beat the S&P 500 [in some years, at least] would be more than offset by the additional 5.0% return on capital saved by trading SLS instead of long shares.
The Dimensional US Large Company Portfolio (DFUSX) is one such example that does not bear out as advertised. A couple years ago, I spoke with an investment adviser (IA) who uses Dimensional Funds for clients. By retaining most benchmark components while excluding just a few, he said, Dimensional funds outperform. On 4/11/24, I looked at DFUSX holdings (as of 2/29/24) to find 504 stock holdings. The most-recent S&P 500 update I can find (Investopedia from 9/26/23) reports 500 companies have issued 503 total stocks. At 504, DFUSX has added and either not excluded or substituted thereby contradicting the IA. DFUSX also has a somewhat-perplexing 505th position: S&P 500 futures. With stock futures usually in contango, this represents a slight drag over time.
SLS no longer seems like a good proxy for DFUSX given the weakened candidacy mentioned five paragraphs above.
In summary, I would avoid SLS as a proxy for long shares to be used for non-option traders [paying an option-trading IA to manage]. While I think T-bills [or something comparable] are a necessary component to supplement an option portfolio, SLS may be a poor proxy even for option traders given the additional expenses related to taxes and transaction fees.**
* — Suggesting that even before the Part 8 discovery, I knew about the time premium expense—
just not how much more time premium is lost by the long call than gained by the short put.
** — As mentioned in this second paragraph, I need to expand the sample to verify the ~0.5%
SLS edge.
Investing in T-bills (Part 18)
Posted by Mark on March 25, 2024 at 16:11 | Last modified: April 11, 2024 09:07As mentioned in the last full paragraph of Part 4, selling puts facilitates T-bill investment by raising cash balance. Short puts are proportional to overall risk, however, and such transactions are subject to specific maintenance margin requirements (MR).
[Initial MR is equal to] Maintenance MR for short puts [and] is calculated differently than that discussed for equities in Part 16. MR is the greatest of:
- Current market value of option(s) + 20% of underlying stock – amount out of the money (OTM; otherwise zero) [1]
- 10% of exercise value of underlying stock + premium value [2]
- Premium value + $50/contract [3]
Example #1: sell six short puts on ABC (stock) at $80 strike price for $2.50 each with ABC at $81.25/share
[1] ($2.50 x (6 x 100)) + [(20% / 100) x ($81.25 x (6 x 100))] – (($81.25 – $80.00) x 600) =
$1,500 + $9,750 – $750 = $10,500
[2] [(10% / 100) x ($80 x (6 x 100))] + ($2.50 x 600) = $4,800 + $1,500 = $6,300
[3] ($2.50 x 600) + ($50 x 6) = $1,500 + $300 = $1,800
$10,500 is greatest (the 20% MR [1]).
Example #2: sell six short puts on XYZ (stock) at $70 strike price for $0.75 each with XYZ at $81.25/share
[1] ($0.75 x (6 x 100)) + [(20% / 100) x ($81.25 x (6 x 100))] – (($81.25 – $70.00) x 600) =
$450 + $9,750 – $6,750 = $3,450
[2] [(10% / 100) x ($70 x (6 x 100))] + ($0.75 x 600) = $4,200 + $450 = $4,650
[3] ($0.75 x 600) + ($50 x 6) = $450 + $300 = $750
$4,650 is greatest (the 10% MR [2]). This is just Example #1 with a lower strike price (hence lower premium) selected.
MR is proportional to number of contracts because the latter gets multiplied by every term in each calculation. In Example #2, MR is therefore $4,650 / 6 contracts = $775/contract. For 12 puts, MR would be: 12 x $775/contract = $9,300.*
A maintenance call (see fifth bullet point) will be issued when:
MR > market value of securities + free cash – debit balance [4]
- Market value of long (short) securities is positive (negative).
- Market value of OTM short options increases to zero at expiration.
- Debit balance is the loan amount when borrowing funds from the brokerage.*
- Customers typically have two business days to satisfy a maintenance call by falsifying [4] else the brokerage will close positions at its discretion (potential worst-case scenario as catastrophic loss may be locked in).
While short puts increase cash balance, hopefully it’s now clear they are subject to MR limitations regarding max quantity with direct implications for risk.
Initial MR for long options is 100% of the purchase price. Cash balance decreases upon purchase and no maintenance MR subsequently applies.
As a reminder, synthetic long stock (SLS) is a combination of long call(s) and short put(s) at the same strike [price].
That light at the tunnel is getting quite bright!
*–MR is not to be confused with margin loan (“debit balance” in [4]) that occurs when cash balance goes negative.
Investing in T-bills (Part 17)
Posted by Mark on March 23, 2024 at 08:51 | Last modified: April 10, 2024 09:26Higher initial/maintenance margin requirements is one reason why option traders may choose [taxable] T-bills [interest] over tax-exempt munis. Another reason to favor T-bills is the muni bond de minimis rule.
I want to clarify interest on zero-coupon T-bills as discussed in the third-to-last full paragraph of Part 16. These are taxed as if interest income were being received even though no income is actually received until the bond matures. Whether price appreciation to par or a semi-annual coupon payment, both are taxable interest as far as Uncle Sam is concerned.
As far as munis (issued by state, city, and local governments) go, interest is generally free from federal taxes and is:
- Usually free from state tax in the state of issuance.
- Not taxed by some states regardless of the state of issuance.
- Sometimes exempt from state tax at the time of issuance by that same state even when said state usually taxes them.
Unlike muni interest, bond price appreciation is usually taxed in accordance with the de minimis rule. At issue is whether price appreciation will be taxed as ordinary income or as capital gains. This is done as follows:
- Multiply the face value by 0.25%.
- Multiply that result by number of full years between bond purchase and maturity date to get de minimis discount.
- Subtract de minimis discount from muni par value to get the minimum purchase price.
- If actual purchase price is less (equal to or greater) than the minimum purchase price, price appreciation on the bond is subject to ordinary income (capital gains) tax rates.
For example, imagine $97.75 purchase of 10-year muni paying 4.00% APY with par value of $99 and six years until maturity.
De minimis discount = $99 x (0.25% / 100) x 6 = $1.485
Minimum purchase price = $99 – $1.485 = $97.515
Because $97.75 > $97.515, price appreciation will be taxed as capital gains. If held for over one year (one year or less), then capital gains tax rates are lower than (equal to) ordinary income tax rates.
The de minimis risk [of having to pay ordinary tax rates on price appreciation] is greater in rising interest rate environments. Since interest rates are inversely proportional to bond prices, increasing rates are associated with decreased bond prices.
One case where price appreciation may be tax-exempt is a zero-coupon municipal bond. These are always bought at a discount since they make no interest/coupon payments and price appreciation to par value is usually not taxed. The biggest caveat seems to be selling before the maturity date. In this instance, any price change realized on zero-coupon munis will be treated as a [short- or long-term depending on holding period] capital gain or loss.
Is that light at the end of the tunnel I see?
I will continue next time.
* — The Part 11 disclaimer applies: please consult a tax advisor for the definitive word on these matters.
Investing in T-bills (Part 16)
Posted by Mark on March 22, 2024 at 09:43 | Last modified: April 10, 2024 09:46Last time, I began to explore the idea of trading options on top of tax-exempt munis since interest on T-bills is taxed at the Federal level. Today I continue the discussion with regard to maintenance margin requirements.
Let’s define two new terms: initial margin and maintenance margin. Initial margin is the percent of purchase price that must be paid with cash in a margin account. Maintenance margin, currently set at 25% of the total securities value per Financial Industry Regulatory Authority requirements, is the amount of equity that must be kept in the margin account going forward.
Maintenance margin for equities is best illustrated by a table:
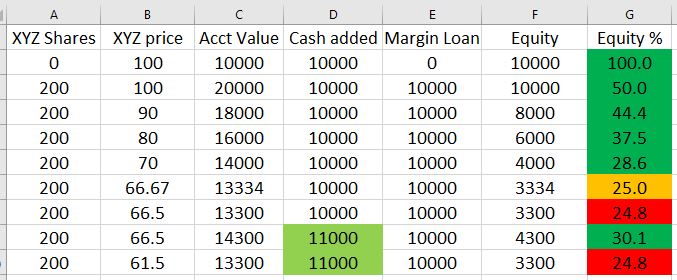
- A margin account is opened by depositing $10,000 (column D).
- Using the $10,000 free cash and $10,000 borrowed from the brokerage (column E), 200 shares of XYZ are purchased at $100/share causing an equity percentage [col G = 100 * (col C – col E) / col C] drop to 50%.
- Equity percentage drops further as the share price drops.
- When XYZ hits $66.67/share, equity percentage is at the minimal threshold of 25%.
- At $66.50/share (a drop of 33.5% from initial purchase price), equity percentage is below threshold. Brokerage will issue a margin call forcing deposit of more cash or securities to avoid sale of XYZ at a big loss.
- Depositing an additional $1,000 (now $11,000 total in column D) restores equity percentage (30.1%) above the minimum threshold where it will remain unless XYZ drops to $61.50/share resulting in a subsequent margin call.
Although taxable, T-bill interest qualifies for 1% initial and maintenance margin for maturities up to six months. This means $100,000 of T-bills may be purchased while preserving $99,000 for option trading. Beware, though! This defines how much capital may be borrowed rather than how much should be invested. As stated in this third paragraph, capital should never be borrowed to invest in T-bills. T-bill investments count 100% against the cash balance* and margin loans begin if cash balance drops below zero (hence the 10% cash buffer mentioned in this second-to-last paragraph).
For the sake of option trading, low maintenance T-bill margin seems like a great deal that is actually just a necessary precaution (see bottom of Part 8) to prevent the brokerage from pocketing additional interest. While the customer gets paid 0.35% on free cash, the brokerage could invest that cash in T-bills to make 5% or more. I need to do more research to determine if this actually happens, but it seems plausible since T-bills are about as safe as any investment can get.
Disadvantaged margining for munis likely offsets their tax-exempt benefit. At my brokerage, initial and maintenance margin are the greater of 20% of the market value or 7% of the face value. I see another brokerage listing maintenance margin at 25% of bond market value (and initial at maintenance margin x 1.25). Either way, munis eat up at least 20x more in buying power than T-bills making them more likely to hamper option trading.
Next time we will study de minimis.
* — In contrast to naked puts that, as discussed in this last full paragraph, raise cash balance.
Investing in T-bills (Part 15)
Posted by Mark on March 20, 2024 at 09:41 | Last modified: April 7, 2024 10:46The meandering mini-series continues with some further comments about taxes and municipal bonds.
As a sidebar to what seems like a series of sidebars, meandering is not a bad thing with these blog posts. What ends up presenting is the opportunity to touch on a number of related subjects. Researching and writing about these topics helps me learn. Hopefully you can gain something too in the form of some well-rounded financial understanding.
Because T-bills (along with all Treasury bonds) are subject to Federal tax [exempt from state and local taxes], I often see the recommendation to hold them in tax-advantaged retirement accounts such as traditional or Roth IRAs. Traditional IRAs owe tax on bond interest only when funds are distributed (withdrawn) rather than as interest is earned. This allows for longer compounding. Roth IRA contributions are fully taxed up front allowing bond interest to be effectively tax-exempt.
Retirement accounts must be cash accounts. Cash accounts are not eligible for margin loans from the brokerage (“trading on margin”). Neither are cash accounts subject to initial and maintenance margin requirements* that enable certain types of option trading such as call writes and short puts.
To me, the cash-versus-margin-account delineation clarifies the bond recommendation from above. Fixed income (i.e. T-bills or other bonds) may be managed as one asset in a diversified portfolio (e.g. an allocation made up of 50% large-cap stocks, 20% small-cap stocks, and 30% fixed income) for which a cash account like an IRA is perfectly suitable. If using T-bills to maximize return on cash left over from option trades, however, then T-bills and options must be in the same account: likely a [option-enabled] margin account rather than an IRA (cash account). The above recommendation would not apply.
With tax on T-bill interest weakening the case for trading synthetic long stock + T-bills in lieu of long shares,** municipal bonds come to mind. “Munis” (municipal bonds) are tax-exempt. They are generally a better choice for higher tax brackets because the amount saved by not owing tax on bond interest taxed is greater. When comparing munis with other bonds, a “tax-equivalent yield” (TEV) is often calculated: TEV = muni yield / (1 – marginal tax rate***).
Given the T-bill from Part 12 paying 5.355% YTM, would a muni paying a 3.8% coupon be a better choice? Assuming a 24% tax bracket (marginal tax rate), the muni:
TEV = 3.800% / (1 – (24 / 100)) = 5.000%
All else remaining equal, in this case T-bill is the better way to go.
I will continue next time.
* — To be addressed later
** — Recall this comparison was the real purpose of the entire mini-series. As discussed in
the first paragraph of Part 11, I got my answer early.
*** — Marginal tax rate is the percentage at which my last dollar of taxable income is taxed.
Investing in T-bills (Part 14)
Posted by Mark on March 19, 2024 at 08:58 | Last modified: April 7, 2024 10:46In the fourth paragraph of Part 12, I mentioned creation of a bond (T-bill) ladder without explaining the what or why.
Bond laddering involves buying bonds with different maturity dates thereby enabling the investor to respond relatively quickly to interest rate changes. Investing in bonds maturing on the same date carries high reinvestment risk: being forced to roll over a large capital allocation of maturing bonds into similar fixed-income products with a much lower interest rate. The ladder therefore facilitates a steadier stream of cash flows throughout.
Reducing reinvestment risk and smoothing out interest payments is of limited importance to me since my T-bills mature within months. The Fed usually decides whether to raise/lower interest rates during its eight scheduled meetings per year (and rarely by more than 50 basis points at a time). Over 3-4 months, drastic interest rate changes have seldom been seen. T-notes (T-bonds) mature in 2-10 (20-30) years—periods of time over which large rate changes are more likely.
Limiting price risk is another benefit of bond laddering that doesn’t apply much to my short-dated T-bills. When interest rates rise, bond prices fall; this affects longer-dated more than shorter-dated bonds.* A worst-case scenario would be large portfolio allocation to long-dated bonds at the unexpected start of a rising interest rate environment followed by a catastrophic life emergency forcing bond sale at a substantially lower price to raise cash. Contrast this with an initial outlay of five equal tranches of capital to bonds maturing in 2, 6, 10, 20, and 30 years. The rising interest rates would not hurt the 2-, 6-, and 10-year T-notes nearly as much as the 30-year T-bonds.
One final benefit to bond laddering is liquidity improvement [of a fixed-income portfolio]. Although Treasurys tend to trade on a relatively liquid secondary market, bonds by their nature are not generally liquid investments and cannot be cashed in anytime without penalty. In the example just given, 20% of the total allocation matures after 2, 6, 10, 20, and 30 years making cash available in a relatively short period rather than having to wait 30 years for any (all) of it.
Liquidity improvement is the main reason I use a bond ladder. Should the stock market move sharply against me, I may need cash to close losing positions. Every week I get a cash-balance infusion when T-bills mature. Rather than reinvest, I can skip a T-bill purchase(s) and use the cash to manage option positions. In combination with the 10% cash buffer (see last two full paragraphs of Part 13), I will hopefully avoid having to borrow funds from my brokerage and paying high margin interest.
I will continue next time.
* — Duration is a bond’s change in price per 1% increase in rates.